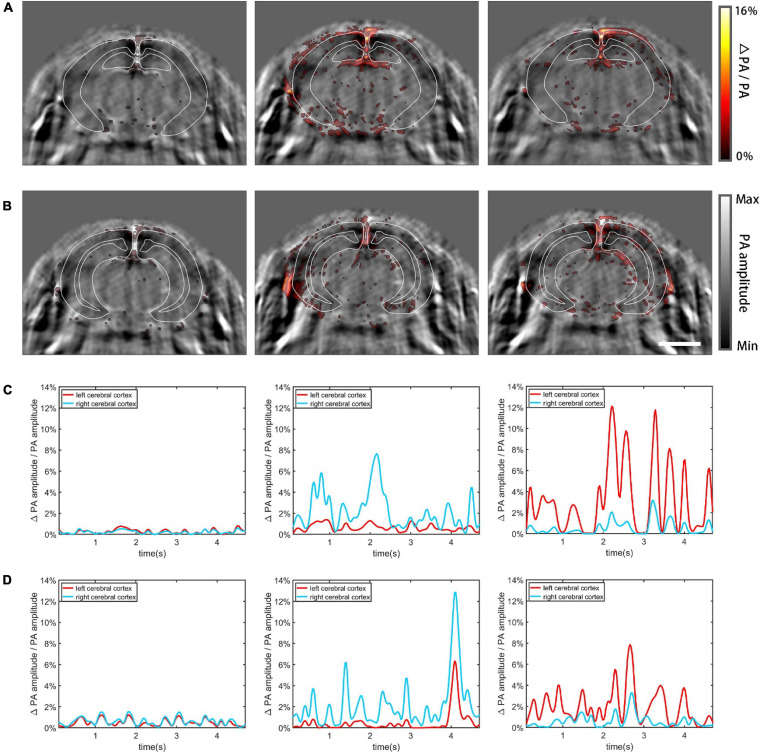
FIGURE 8.
Functional cerebral hemodynamic PACT imaging results. The functional hemodynamic changes are in pseudo-color and the structural images are in grayscale as background. (A) Functional PACT images of the midbrain corresponding to: no external stimulation (left), left forepaw stimulation (middle), and right forepaw stimulation (right). (B) Functional PACT images of the hindbrain in the three cases as in panel (A). (C) Relative change of the total signal in the midbrain cerebral cortex corresponding to the three different cases as in panel (A). (D) The same plots as in panel (C) for the hindbrain. Scale bar = 3 mm.

