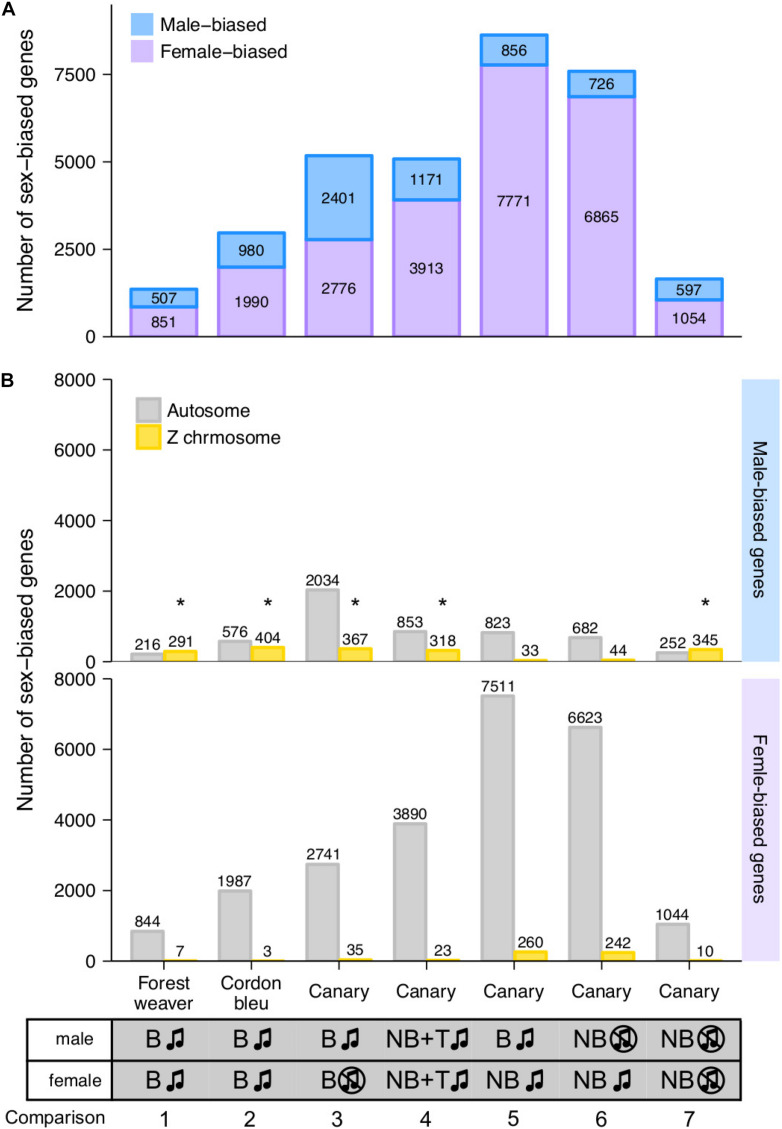
FIGURE 2.
Female- and male-biased sex differences in HVC gene expression levels in songbirds. (A) The bar graph summarises the number of sex-biased genes in the HVC transcriptome identified from each male-to-female comparisons. The phenotypes of the groups being compared in each male-to-female comparison are listed at the bottom of the graph. (B) The bar graph summarises the number of autosomal and Z chromosomal genes classified as male- and female-biased genes in the HVC transcriptome based on each male-to-female comparison. B, breeding; NB, non-breeding; T, testosterone implantation. The music note indicates the presence or absence of singing behaviour; the asterisk (*) indicates enrichment for Z chromosomal genes (adjusted p < 0.05, Fisher’s exact test followed by the Bonferroni correction for multiple testing, see Supplementary Table 1).

