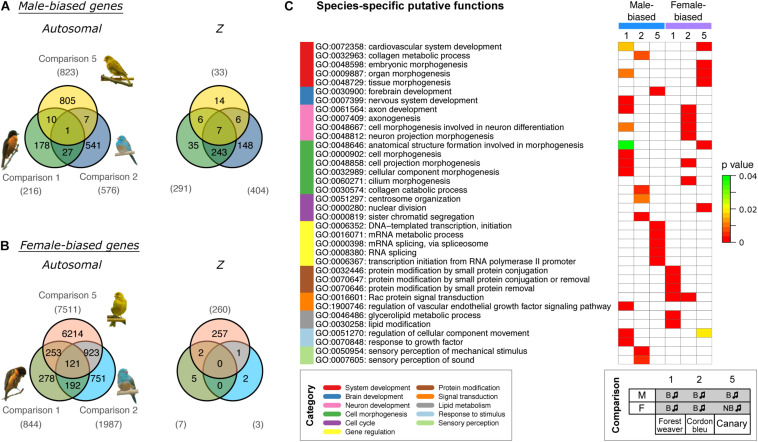
FIGURE 3.
Cross-species comparisons of sex-biased genes expressed in the HVC of birds with singing phenotypes shows high species specificity. Venn diagrams of male-biased (A) and female-biased (B) autosomal and Z chromosomal genes. The numbers of sex-biased genes are indicated in parentheses. (C) GO term enrichment analysis predicting the biological functions of sex-biased (autosomal and Z chromosomal) genes. The GO terms were categorised and are colour coded. Bonferroni-adjusted P-values are shown by colour scales in the heatmap. Only five GO terms with the lowest Bonferroni-adjusted P-values are shown for each set (see Supplementary Table 2 for the complete results). The phenotypes of the groups used for comparisons 1, 2, and 5 are listed at the bottom. B, breeding; NB, non-breeding. The music note indicates the presence or absence of singing behaviour.

