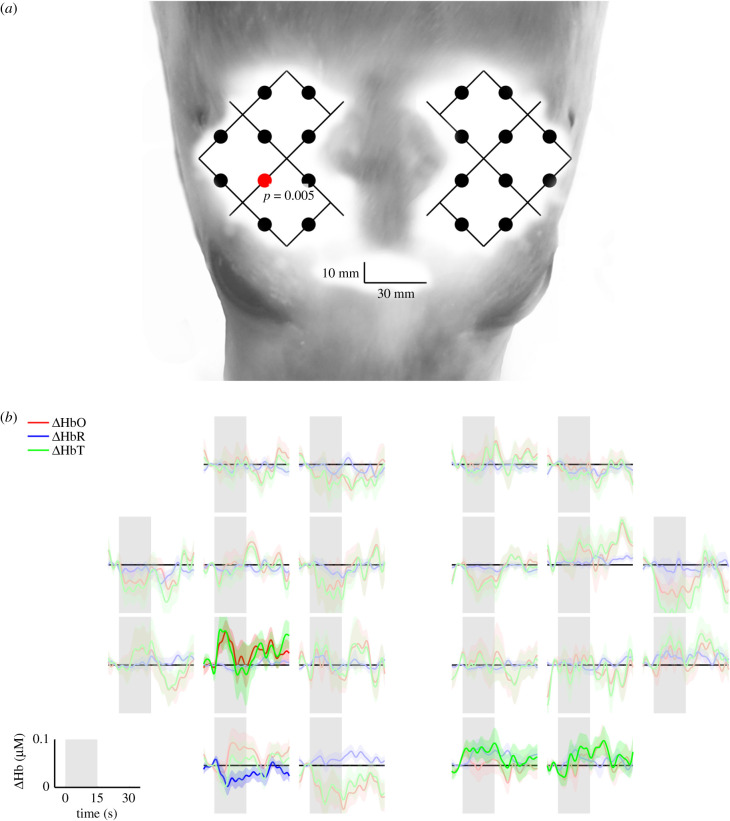
Figure 4.
(a) Channels displaying statistically significant (p < 0.05) group average [HbO] changes during right vibrissal stimulation are indicated by red dots. The optical array is visualized over the head of a juvenile grey seal to provide anatomical perspective of regional activation. (b) Corresponding group average (lines) and standard error (ribbons) changes in [HbO], [HbR] and [HbT] over 15 s of right vibrissal stimulation (shaded grey area) followed by 15 s of no left vibrissal stimulation (white area). Strong colours represent a significant (p < 0.05) change in [HbO] and where [HbO] and [HbR] were negatively correlated.

