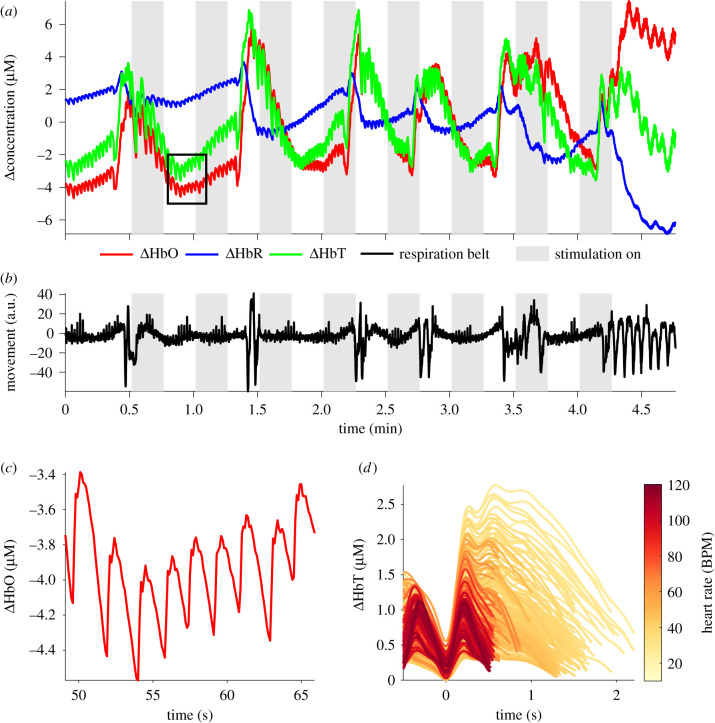
Figure 6.
(a) Example of the raw [HbO] (red line), [HbR] (blue line) and [HbT] (green line) traces from a seal during the study, showing pulsatile cardiac waveform (for black box, see (c)) and dynamics associated with respiration. (b) Signal from the respiration band where the magnitude is directly correlated to chest movement. (c) Cardiac pulsation in [HbO] magnified from the black box in (a). (d) Cardiac pulsation of ΔHbT in a grey seal. Colour encodes the underlying heart rate (beats min−1), beginning at diastolic minima at 0 s and ending at the next diastolic minima, revealing increasing pulse magnitude with lowering heart rates.

