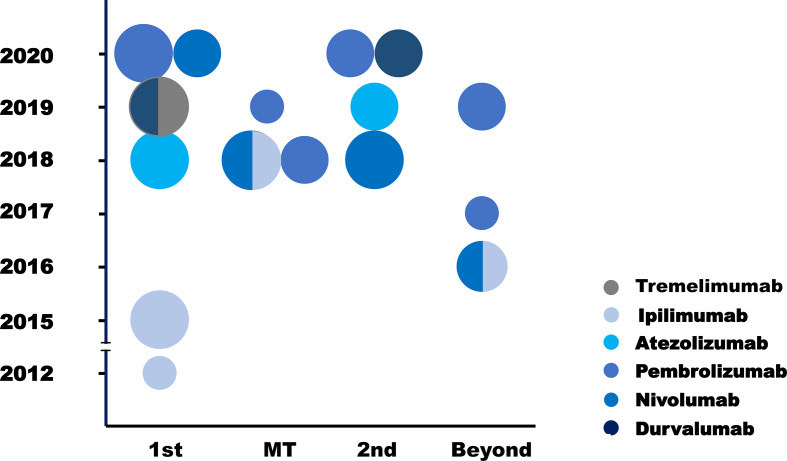
Figure 1.
Clinical trials of ICIs in SCLC. Each circle standed for one trial. The different circle areas represented phase I, phase II and phase III trials respectively, and different color meant different drugs. Y axis stood for the year of the publication of each trial, and X trials was the clinical situation where each trial was performed. 1st, first line; MT, maintenance therapy; 2nd, second line; Beyond, later line.

