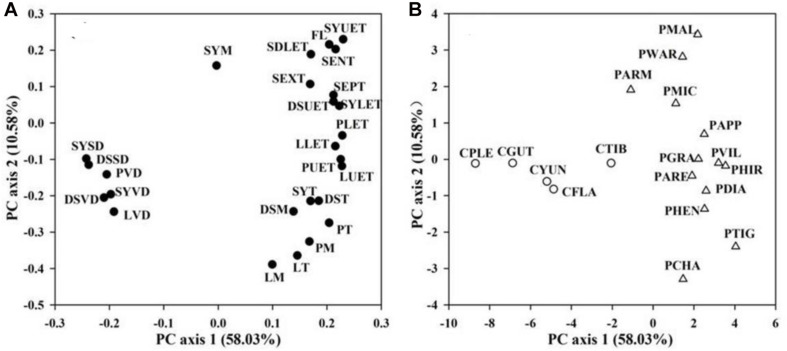
FIGURE 3.
Principal component analysis (PCA) based on 26 floral traits (A) from 28 slipper orchids. PCA axes are presented in (B). Values in parentheses along each axis indicate percentages of explained variation. Abbreviations for traits and species are shown in Table 1 and Supplementary Table 1, respectively.

