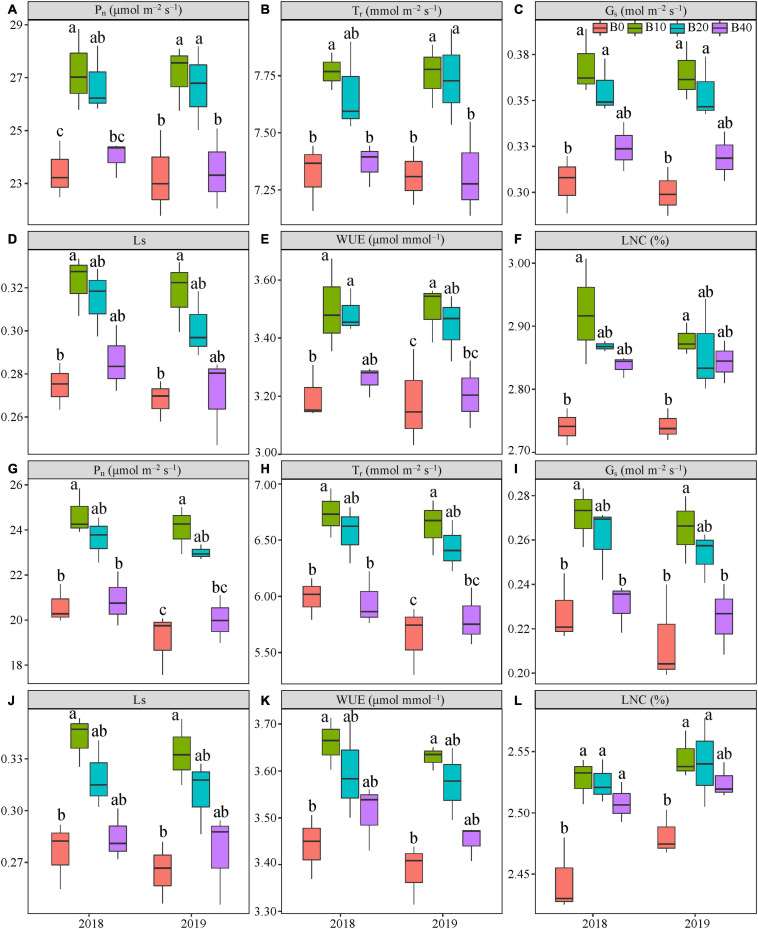
FIGURE 3.
Gas exchange parameters at flowering (A–F) and pod set (G–L) in peanut applied with four biochar rates in 2018 and 2019 growing seasons. Y and B represent year and biochar application, respectively. Pn, net photosynthetic rate; Tr, transpiration rate; Gs, stomatal conductance; Ls, stomatal limitation; WUE, water-use efficiency; and LNC, leaf nitrogen content. B0, B10, B20, and B40 represent biochar application rates of 0, 10, 20, and 40 t ha−1, respectively. For each parameter in each year, mean data with different letters denote significant differences among treatments at P < 0.05.

