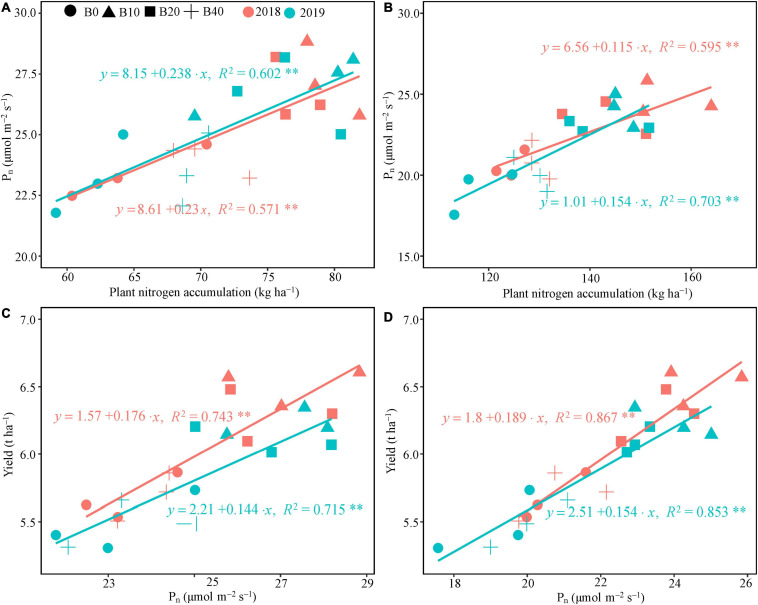
FIGURE 4.
Relationship between plant nitrogen accumulation and photosynthetic rate, and yield and photosynthetic rate at flowering (A,C) and pod set (B,D) in peanut applied with four rates of biochar in the 2018 and 2019 growing seasons. B0, B10, B20, and B40 represent biochar application rates at 0, 10, 20, and 40 t ha−1, respectively. Pn, net photosynthetic rate; **represents significant correlations at the P < 0.01 level.

