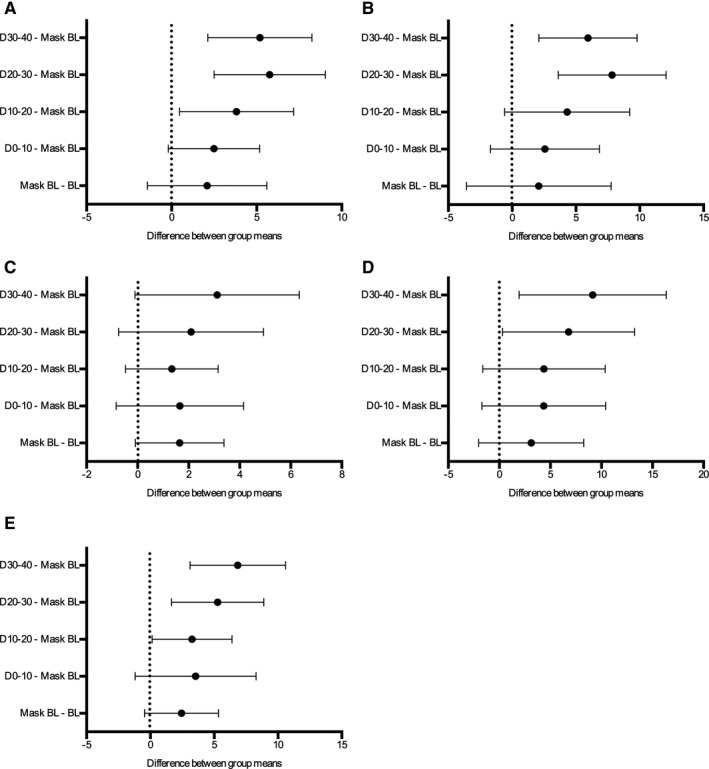
Figure 4. The mean difference with 95% CIs for muscle sympathetic nerve activity (MSNA) burst frequency (A).

B, MSNA burst incidence. C, Average normalized MSNA burst area. D, MSNA burst amplitude (height). E, Burst area. For percentage of normalized bursts that were greater than half of the maximum burst for each individual subject. BL indicates baseline. D0–10 indicates DE exposure between 0 to 10 mins; D10–20 the DE exposure from 10 to 20 mins; D20–30 the DE exposure from 20 to 30 mins; and D30–40 the DE exposure from 30 to 40 mins.
