
Figure 6. Relationship between MSNA amplitude (burst height), the percentage of bursts >50% of the maximum burst amplitude compared with heart rate.
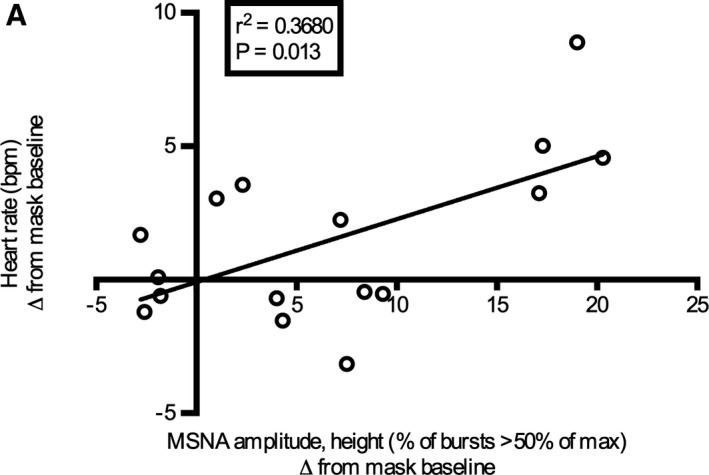
Data plotted are the differences from mask baseline for the 20‐ to 30‐minute time point values. Pearson correlation coefficient test was used and the line fitted using nonlinear regression with least squares fit.