
Figure 1. Circulating biomarkers in groups receiving low‐dose (400 IU/d) or high‐dose (4000 IU/d) vitamin D supplementation over 6 months.
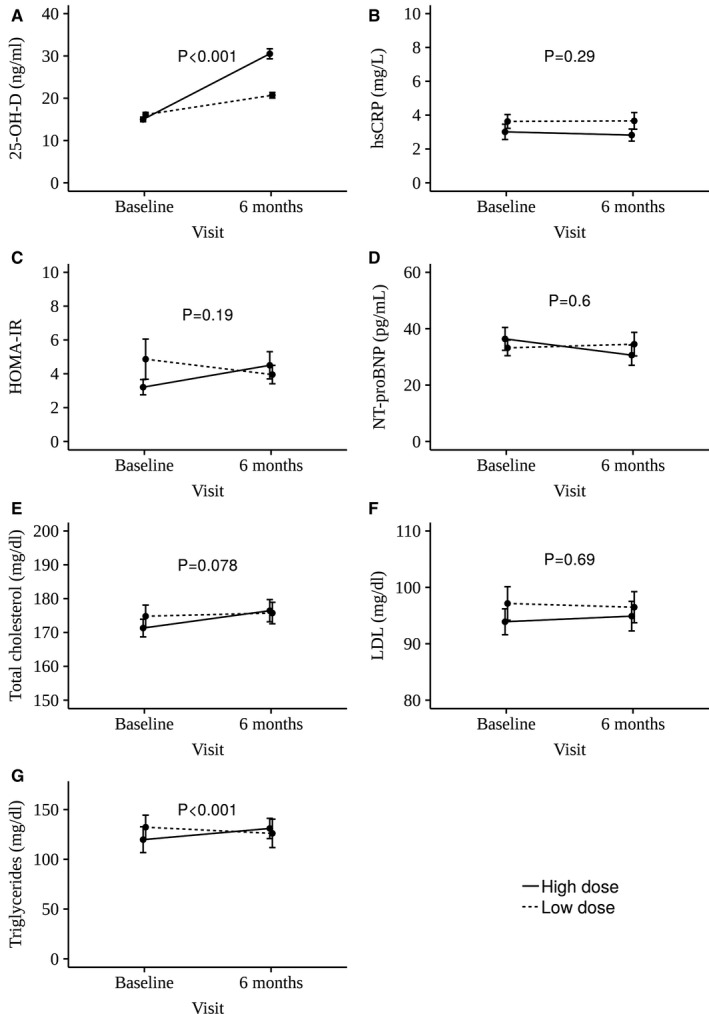
Mean change ±1 standard error in 25‐hydroxyvitamin D (25‐OH‐D; A), high‐sensitivity C‐reactive protein (hs‐CRP; B), homeostatic model assessment of insulin resistance (HOMA‐IR; C), NT‐proBNP (N‐terminal pro‐B‐type natriuretic peptide; D), total cholesterol (E), low‐density lipoprotein (LDL; F), and triglycerides (G) in the high‐dose and low‐dose vitamin D supplementation groups are reported.