
Figure 2. Forest plots comparing effect size for vitamin D supplementation on changes in biomarkers for studies included in the meta‐analysis.
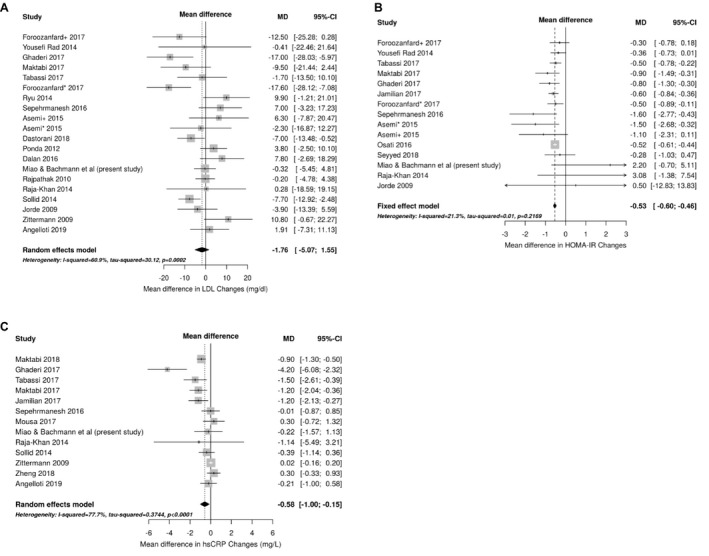
Changes in low‐density lipoprotein (LDL; A), homeostatic model assessment of insulin resistance (HOMA‐IR; B), and high‐sensitivity C‐reactive protein (hs‐CRP; C) are reported. The gray boxes correspond with study precision, and the lines denote 95% CIs. Studies are ordered by the cumulative vitamin D dose delivered during the course of the study (vitamin D dose×duration), from lowest to highest. The asterisks and plus sign denote combinations of vitamin D with or without calcium supplementation for two different treatment arms enrolled in the same RCT. Asemi* indicates vitamin D 50 000 IU weekly+calcium 1000 mg daily whilst Asemi+ group received vitamin D 50 000 IU weekly; Foroozanfard*, vitamin D 4000 IU daily; Foroozanfard+, vitamin D 1000 IU daily; and MD, mean difference. References: Foroozanfard+ 2017, 11 Yousefi Rad 2014, 12 Ghaderi 2017, 13 Maktabi 2017, 14 Tabassi 2017, 15 Foroozanfard* 2017, 11 Ryu 2014, 16 Sepehrmanesh 2016, 17 Asemi+ 2015, 18 Asemi * 2015, 18 Dastorani 2018, 19 Ponda 2012, 20 Dalan 2016, 21 Rajpathak 2010, 10 Raja‐Khan 2014, 22 Sollid 2014, 23 Jorde 2009, 24 Zittermann 2009, 25 Angelloti 2019, 26 Jamilian 2017, 27 Osati 2016, 28 Seyyed 2018, 29 Maktabi 2018, 30 Mousa 2017, 31 and Zheng 2018. 32