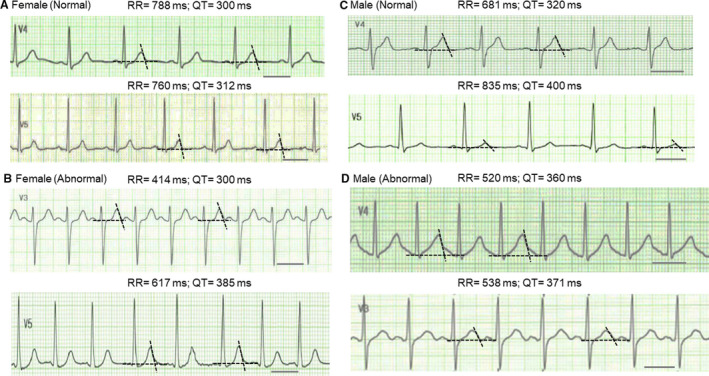
Figure 1. Representative ECG traces following seizure episodes.

A, ECG traces from a 44‐year‐old female patient (upper panel) and a 37‐year‐old female patient (lower panel) without structural brain abnormality. The lead showing the longest QT interval was selected for each patient. The black bar indicates 400 ms. The average values of 2 measurements by 2 examiners were shown for RR and QT intervals. B, ECG traces from a 76‐year‐old female patient with brain abnormality (upper panel) and an 83‐year‐old female patient with cerebral infarction (lower panel). C, ECG traces from a 49‐year‐old male patient (upper panel) and a 48‐year‐old male patient (lower panel) without brain abnormality. D, ECG traces from a 73‐year‐old male patient with chronic subdural hematoma (upper panel) and a 48‐year‐old male patient who had surgery for brain tumor (lower panel).
