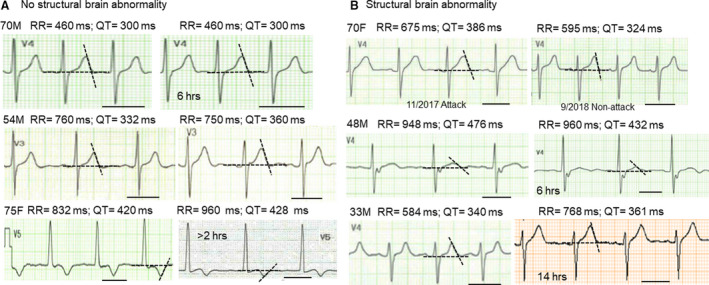
Figure 2. Comparison of postictal ECG traces with follow‐up ECG traces.

A, ECG traces obtained after seizure episodes and follow‐up ECG traces in 3 patients without brain abnormality. The lead showing the longest QT interval was selected for each patient. The black bar indicates 400 ms. The average values of 2 measurement (2 personnel) were shown for RR and QT intervals. B, ECG traces obtained after seizure episodes and follow‐up ECG traces in 3 patients with brain abnormality: brain tumor surgery (upper panel); brain trauma (mid panel); and metastatic brain tumor (lower panel). QTc intervals (Fridericia): initial, 443, 485, 407 ms vs follow‐up, 400, 438, 394 ms. Note that the follow‐up time varied depending on the patient. F indicates female; and M, male.
