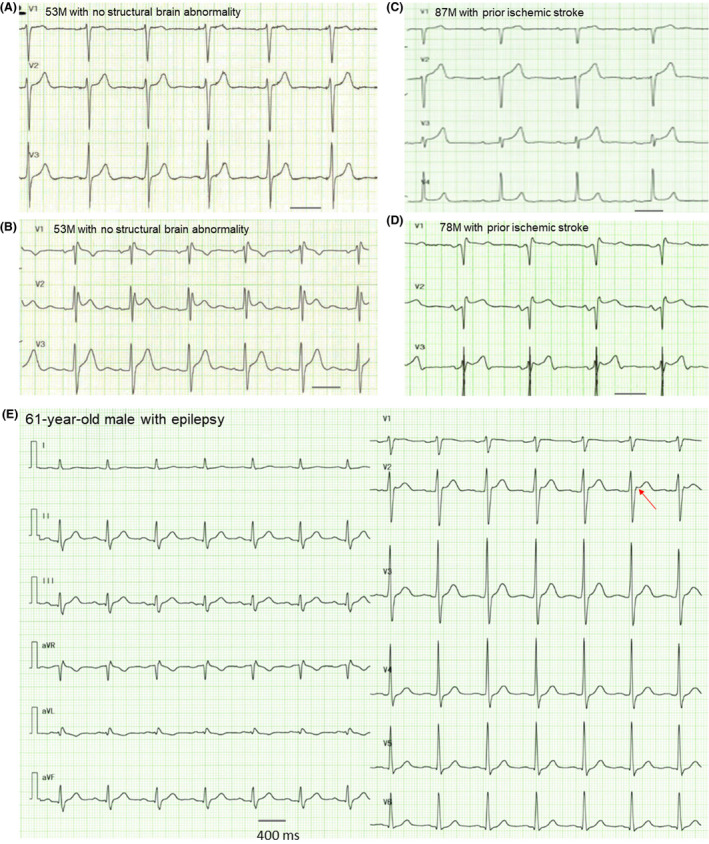
Figure 3. ECG traces and 12‐lead ECG after seizure attacks.

Precordial leads obtained from 4 patients showing ST‐segment elevation (A through D). A 12‐lead ECG obtained a patient who died suddenly 2 days after discharge. Black bars indicate 400 ms. (E). Clinical information is described in the text. F indicates female; and M, male.
