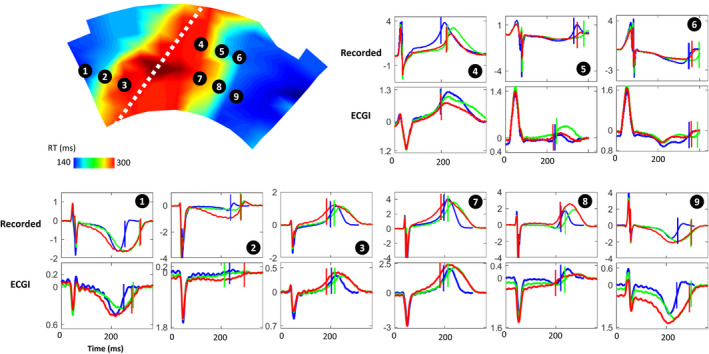
Figure 2. Recorded (top) and ECGI reconstructed (bottom) epicardial electrograms with repolarization times (vertical lines) for a representative case using torso tank data.

Electrograms are presented for electrodes marked on the recorded repolarization map during dofetilide+pinacidil perfusion, at (1) baseline (blue) with no drug perfusion; (2) with dofetilide‐only (green) perfusion in non‐LAD coronaries, which prolongs RT; and (3) with the additional perfusion of pinacidil (red) in the LAD (white dashed line) which shortens RT. ECGI indicates electrocardiographic imaging; LAD, left anterior descending artery; and RT, repolarization time.
