
Figure 4. Linear regression plots of recorded and ECG‐derived mean repolarization time (mean RT; top left), std RT (top right), total RT dispersion (TRTD; bottom left), and kernel probability distribution peak timings (bottom right) from both in vivo (blue) and ex vivo (red) data.
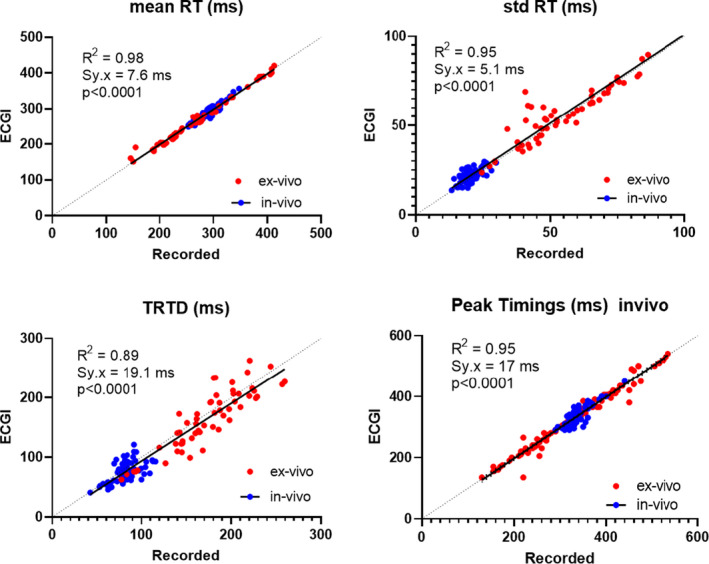
For all plots, there was no significant difference between regression fits for 5 in vivo and 9 ex vivo data sets (P>0.10). Data collected from 146 cardiac sequences.