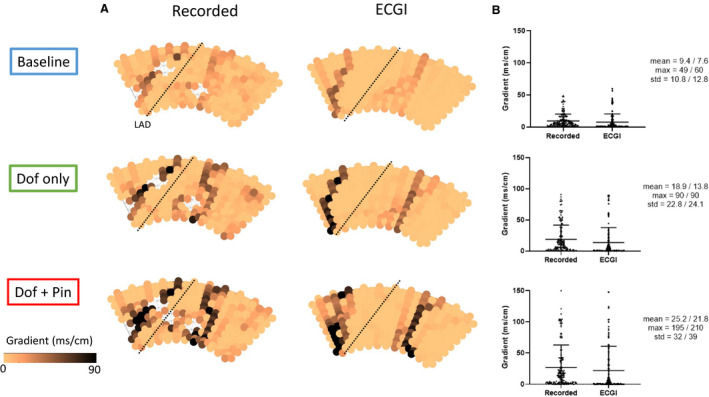
Figure 5. Evaluation of ECGI reconstructed RT gradients.

A, Recorded and ECGI reconstructed RT gradient maps at baseline (blue) with no drug perfusion, with dofetlide‐only (green) perfusion in non‐LAD coronaries, and with additional perfusion of pinacidil (red) in the LAD (black dashed line). B, Distribution of RT gradients with mean, max and SD from recorded/ECGI reconstructions respectively. ECGI indicates electrocardiographic imaging; LAD, left anterior descending artery; and RT, repolarization time.
