
Figure 7. Evaluation of ECGI reconstructed electrograms, RT and RT gradients (ΔRT) for a representative in vivo data set during left ventricular apical pacing.
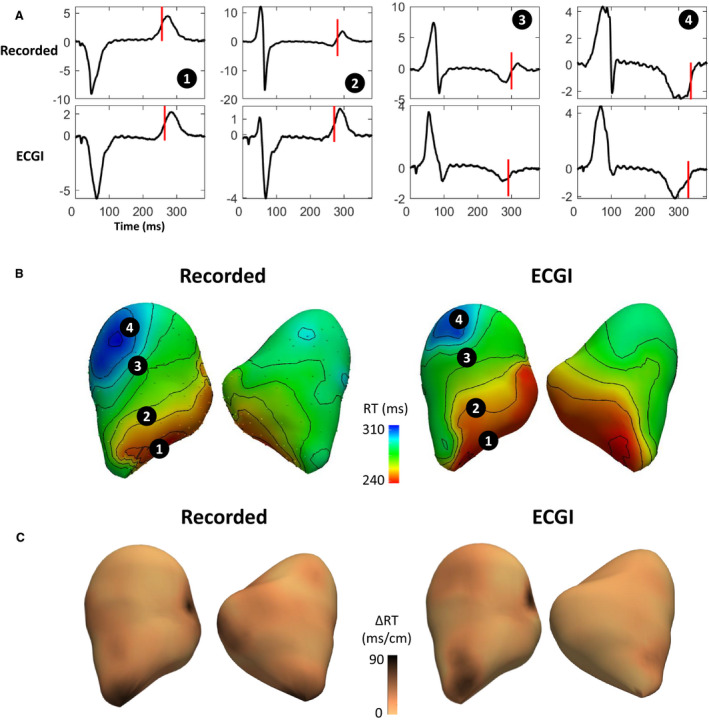
A, Recorded (top) and ECGI (bottom) reconstructed epicardial electrograms with RTs (vertical lines). Electrograms are located at electrodes marked on the recorded and ECG (B) RT maps with (C) ΔRT maps below. ECGI indicates electrocardiographic imaging; and RT, repolarization time.