
Figure 2. Vasoactive hormones in plasma during angiotensin II infusion after potassium supplementation and after placebo.
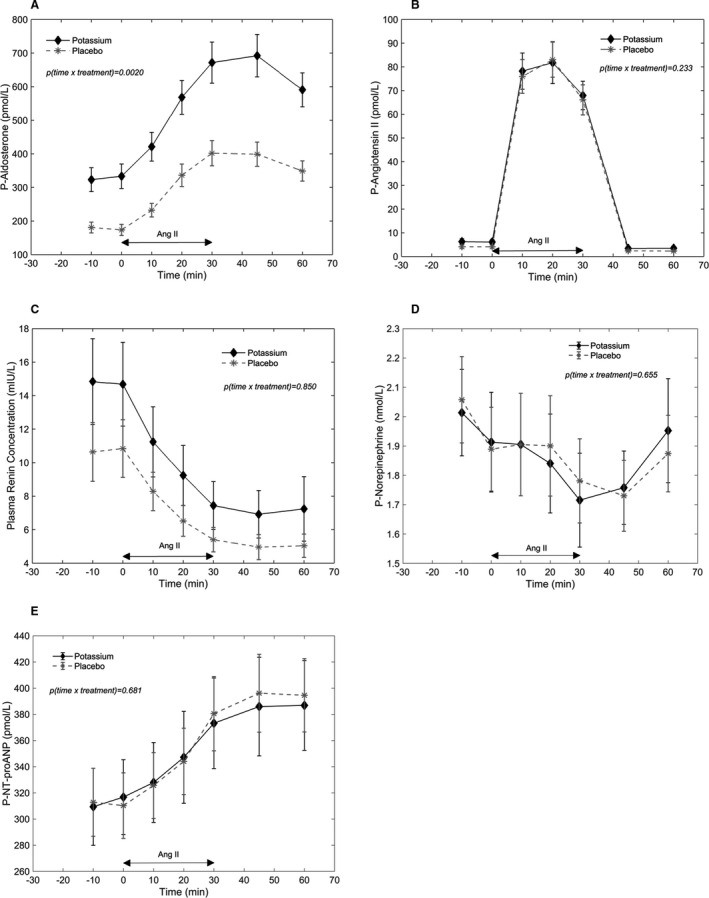
Symbols and bars are equal to mean and SEM. P values on the figures are P values for interaction between time and treatment. A, Aldosterone. B, Angiotensin II. C, Plasma renin concentration. D, Norepinephrine. E, P‐NT‐proANP (N‐terminal pro‐atrial natriuretic peptide). Ang II indicates angiotensin II; and P plasma.