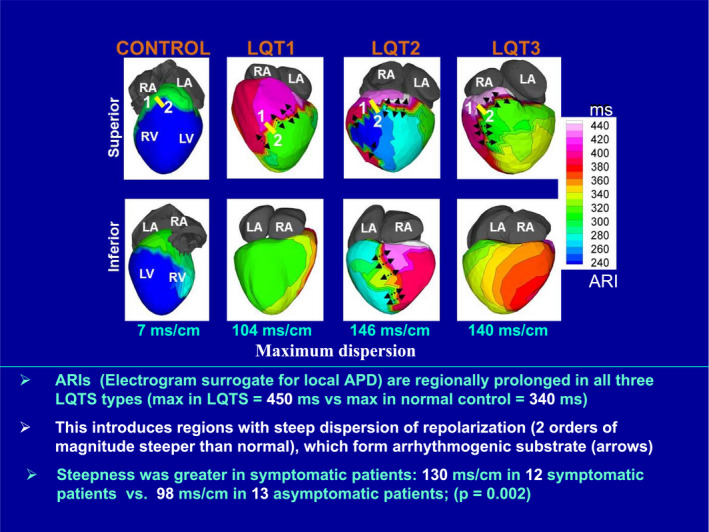
Figure 1. Electrocardiographic imaging maps (superior and inferior views) of repolarization activation‐recovery intervals (ARIs) in the most common types of long‐QT syndrome (LQTS).

Normal control is shown in the left column. Steep repolarization gradients are indicated by arrows. Adapted with permission from Vijayakumar et al, 14 ©2014, Wolters Kluwer Health, Inc. APD indicates action potential duration; LA, left atrium; LQT, long QT; LV, left ventricle; max, maximum; RA, right atrium; and RV, right ventricle.
