
Figure 1. Polyethylene glycol‐20k and MCC950 restored myocardial mitochondrial function after cardiac arrest and cardiopulmonary resuscitation.
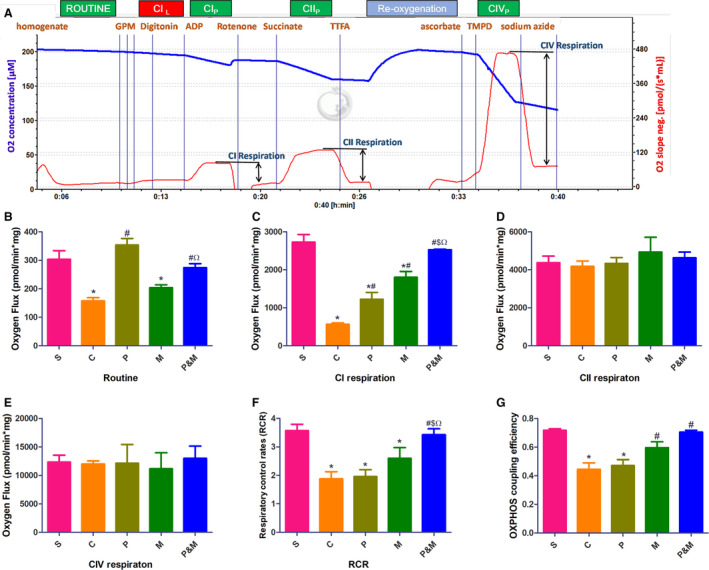
Exemplary respirometric traces outlining the protocol applied in the high‐resolution respirometry experiment (A). Blue line indicates O2 concentration (μmol/L, left y‐axis), red line indicates O2 flux in pmol/(s×mL), right y‐axis. B, Routine respiration; (C), complex I‐linked respiration; (D), complex II‐linked respiration; (E), complex IV‐linked respiration; (F), respiratory control rates; (G), oxidative phosphorylation coupling efficiency. C indicates cardiac arrest control group; CI, complex I‐linked respiration; CII, complex II‐linked respiration; CIL , the non‐phosphorylating LEAK‐respiration; CIP , complex I‐linked phoshorylating capacity; CIIP , complex II‐linked phoshorylating capacity; CIVP , complex IV‐linked phoshorylating capacity; CIV, complex IV‐linked respiration; M, MCC950 group; MAP, mean artery pressure; OXPHOS, oxidative phosphorylation; P&M, polyethylene glycol‐20k‒MCC950 group, a highly selective NLRP3 inflammasome inhibitor; P, polyethylene glycol‐20k group; RCR, respiratory control rates; and S, sham control group without cardiac arrest. *P<0.05 vs S, # P<0.05 vs C, $ P<0.05 vs P, Ω P<0.05 vs M, respectively. All statistical analysis was performed by 1‐way ANOVA, followed by Tukey post‐hoc analysis (n=6 for each group). Each sample was measured in duplicate. Data are expressed as the mean±SD.