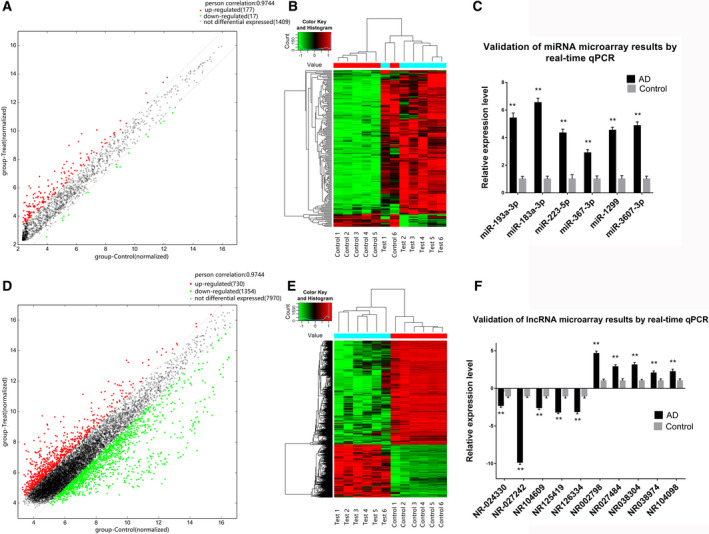
Figure 4. Comparison of miRNA and lncRNA expression profile between the aortic dissection samples and normal control samples.

A, miRNA expression profile. The green plots are decreased and red plots are upregulated differentially expressed genes. B, Heat map of miRNA profile. C, Quantitative reverse transcription‐PCR validation of miRNA microarray. D, lncRNA expression profile. E, Heat map of lncRNA profile. F, Quantitative reverse transcription‐PCR validation of lncRNA microarray. AD indicates aortic dissection; and qPCR, quantitative reverse transcription–polymerase chain reaction. **P<0.01.
