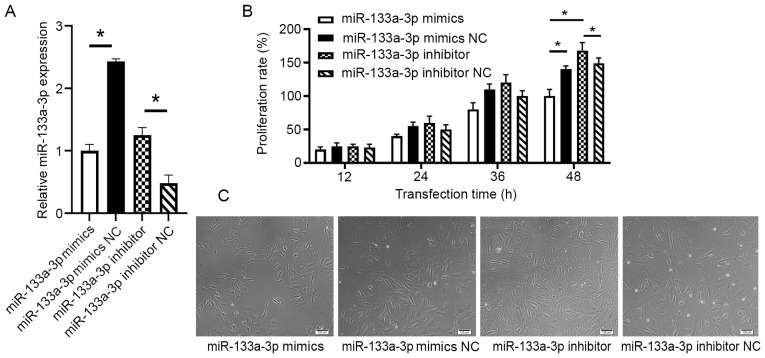
Figure 2.
Effect of miR-133a-3p on cell proliferation. (A) Reverse transcription-quantitative polymerase chain reaction results verified the expression level of miR-133a-3p in different groups. (B) Proliferation rate measured by absorbance values of different groups in Cell Counting kit-8 assay. (C) View under microscope 48 h after transfection in different groups. Scale bar, 100 µm. *P<0.05. miR, microRNA; NC, negative control.

