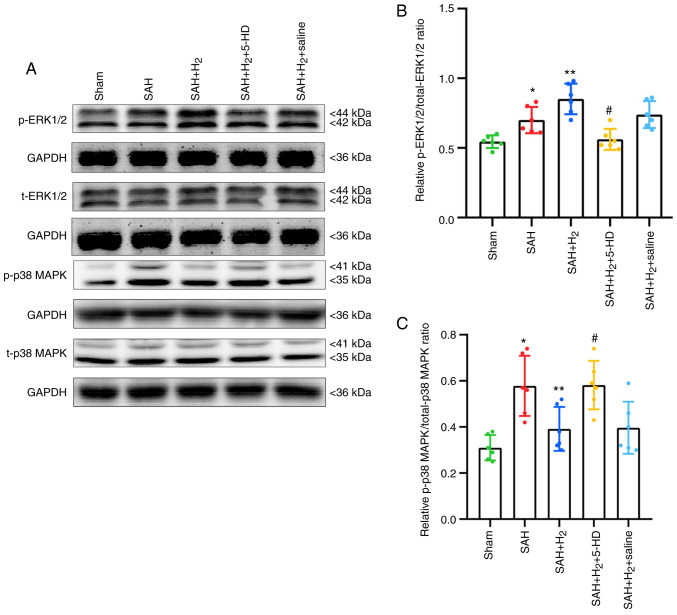
Figure 7.
Changes in the phosphorylation levels of ERK1/2 and p38 MAPK following the indicated treatment. (A) Representative western blotting images of phosphorylated ERK1/2, total ERK1/2, phosphorylated p38 and total p38 MAPK in the cortical tissue. Expression of (B) phosphorylated ERK1/2 and total ERK1/2, (C) phosphorylated p38 and total p38 MAPK was quantified following normalization to that of GAPDH. Data are presented as the mean ± SD (n=6 per group). *P<0.05 vs. Sham; **P<0.05 vs. SAH; #P<0.05 vs. SAH + H2. SAH, subarachnoid hemorrhage; 5-HD, 5-hydroxydecanoate sodium; NeuN, neuronal nuclei; p-, phosphorylated; t-, total.

