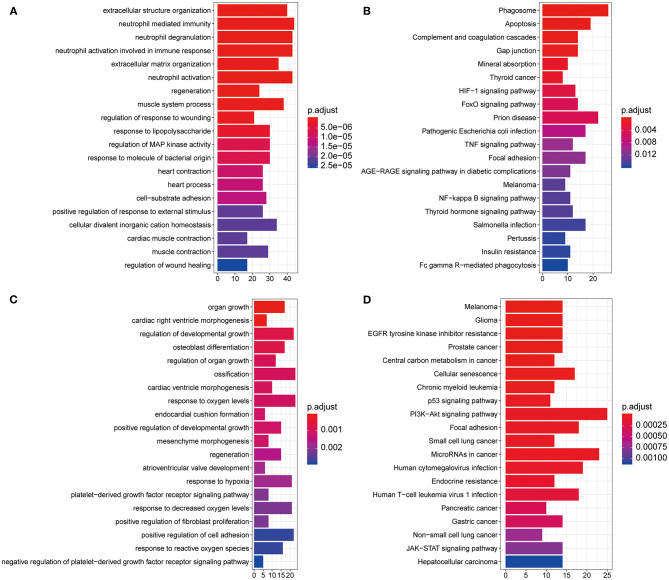
Figure 2.
Gene Ontology (GO) and Kyoto Encyclopedia of Genes and Genomes (KEGG) pathway enrichment analysis. (A) Histogram of the top 20 most significantly enriched GO terms from DEGs in GSE36961. The x axis shows number of mRNAs, and the y axis shows the name of GO terms. (B) The top 20 most significantly enriched KEGG pathways of DEGs. The x axis shows number of mRNAs, and the y axis shows the name of KEGG pathways. (C,D) Histogram of the top 20 most significantly enriched GO terms (C) and KEGG pathways (D) from DEMs in GSE36946. DEGs, differentially expressed genes; DEMs, differently expressed miRNAs.

