Figure 1.
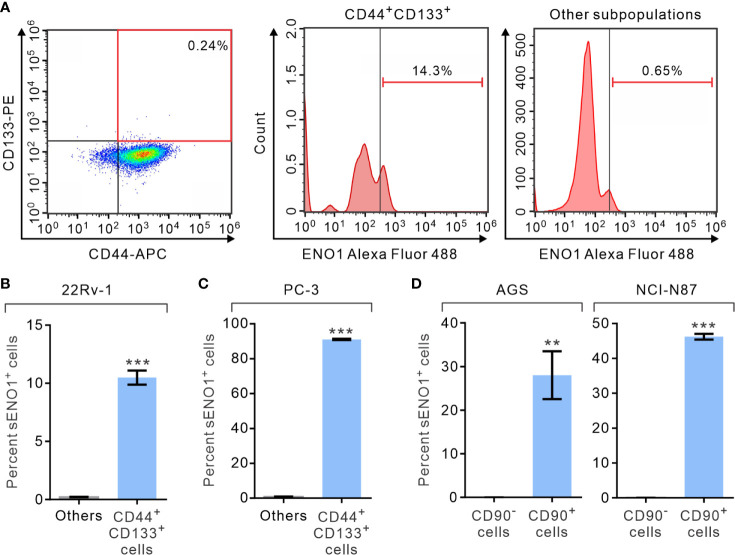
The expression of ENO1 on the cell-surface of a subpopulation of CSCs. (A) Representative FACS plots showing patterns of CD44, CD133, and surface ENO1 (sENO1) staining of primary prostate adenocarcinoma (PAC)-derived 22Rv-1 cells with the frequency of the boxed CD44+CD133+ cell population (representing CSCs in PAC; left) or sENO1+ cells in CD44+CD133+ CSCs (middle) or cells in the other subpopulations (representing non-CSCs; right) shown. (B) The percentages of sENO1+ cell subpopulation in CD44+CD133+ 22Rv-1 cells or cells in the other subpopulations (others). (C) The percentages of sENO1+ cell subpopulation in CD44+CD133+ PC-3 cells or cells in the other subpopulations. (D) The percentages of sENO1+ cell subpopulation in CD90+ gastric adenocarcinoma (GAC) AGS or NCI-N87 cells (representing CSCs in GAC) or CD90- cells (representing non-CSCs). Error bars represent mean ± SEM from three independent experiment (n = 3). Unpaired t-test was performed throughout where **p < 0.01; ***p < 0.001 in (B–D).

