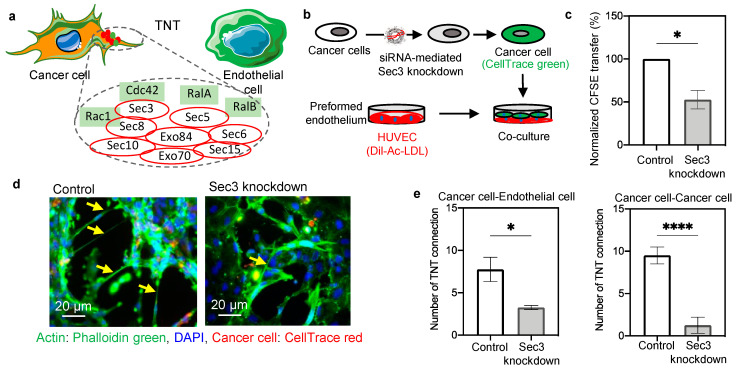
Figure 2.
Involvement of exocyst proteins in TNT formation. (a) Schematic representation of the nanotube connection between a cancer cell and an endothelial cell and the involvement of actin remodeling pathway. The involvement of the exocyst complex and small GTPases in actin polymerization and TNT formation is shown schematically. The exocyst complex, is a combination of eight proteins (Sec3, Sec5, Sec6, Sec8, Sec10, Sec15, Exo70, and Exo84) that interact with small Ras GTPases (like, Cdc42, Rac1, RalA/B) to fulfill the energy requirement for the actin polymerization. (b) Schematic representation of the experimental design of the Sec3 knockdown in the cancer cells and the co-culture setup with preformed endothelium. (c) Graph showing the reduction of CFSE transfer upon knockdown of Sec3 (one of the major exocyst proteins) in cancer cells. siRNA-mediated knockdown of Sec3 was performed in cancer cells by lipofectamine-based transfection. Post knockdown, cancer cells were stained with CFSE and employed in co-culture with Dil-Ac-LDL stained HUVECs. After 24 h the amount of CFSE transfer was checked by FACS analysis and compared with the control (without Sec3 knockdown) condition. (d) Representative image of co-culture showing a reduced amount of TNT formation in the case of Sec3 knockdown of cancer cells. Cancer cells were stained with CellTrace red and co-cultured with unstained HUVECs. After 24 h, the co-culture was fixed, stained with phalloidin green and DAPI, and images were captured with an inverted fluorescence microscope. (e) Graph representing a quantification of the number of heterotypic (cancer cell–endothelial cell) and homotypic (cancer cell–cancer cell) nanoscale connections in the control and the Sec3 knockdown condition. The number of homotypic and heterotypic TNTs was counted from at least eight images in each control and knockdown group. The number of cancer cell–endothelial cell (heterotypic) and cancer cell–cancer cell (homotypic) TNT connections in the knockdown group was significantly reduced in comparison to the control group. Data are represented as ±SEM, and an unpaired two-tailed t-test was performed with Welch’s correction * p = 0.0215 (for cancer–endothelial) and **** p < 0.0001 (for cancer–cancer).

