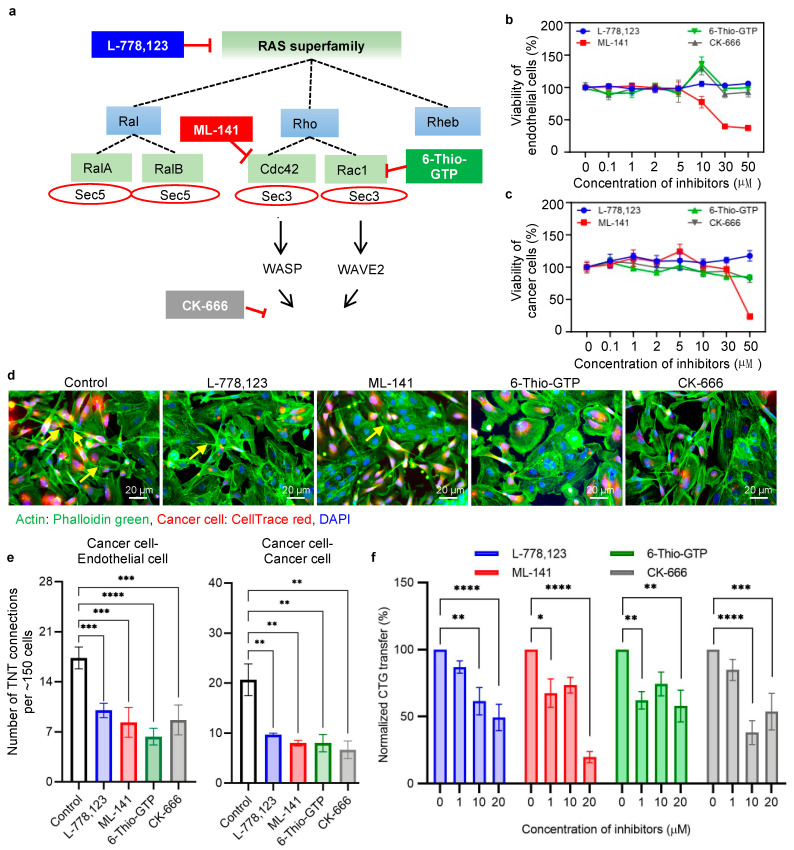
Figure 3.
Effect of RAS GTPase inhibitors on TNT formation and CFSE transfer. (a) Schematic representation of the signaling cascade of the small Ras family GTPases and exocyst proteins involved in actin polymerization. Specific inhibitors were selected to downregulate proteins in different stages of the signaling pathway. A geranylgeranyltransferase-1 inhibitor, L-778,123, potentially inhibits K-Ras prenylation, ML-141 inhibits activation of Cdc42 GTPase, 6-Thio-GTP inhibits Rac1 GTPase activation, and CK-666 blocks the dimerization of Arp2 and Arp3, which is involved in the formation of new actin filaments. (b) Cell viability of endothelial cells in the presence of inhibitors. Cells were treated with different concentrations of inhibitors 0.1–50 µM for 24 h, and the cell viability was measured by MTT assay. The only significant reduction in cell viability was observed at 30 µM and 50 µM concentrations of ML-141 in case of endothelial cells. (c) Similarly, cancer cell viability was checked in the presence of inhibitors. Only a concentration of 50 µM of ML-141 was found to be toxic in cancer cells. (d) Representative fluorescence microscopy images show the effect of inhibitors in nanoscale communication between cancer cells and endothelial cells. Cancer cells (MDA-MB-231) were loaded with CellTrace red and co-cultured with preformed endothelium in 3D tumor matrix, in the presence and absence of inhibitors. Each inhibitor (L-778,123, ML-141 and 6-Thio-GTP) was used separately at a concentration of 10 μM (except 40 μM for CK-666). The co-culture was stained with phalloidin green to visualize the nanotubes. A visible difference in the number of nanoscale communications was observed in the presence of inhibitors. (e) Graph representing the quantification of the number of heterotypic (cancer cell–endothelial cell) and homotypic (cancer cell–cancer cell) nanoscale connections in the control compared with inhibitor-treated conditions. Five images (per experiment) were taken per condition (vehicle control, L-778,123, ML-141 and 6-Thio-GTP, each 10 µM concentration and CK-666 40 µM concentration), with ~150 cells in total being examined, and the number of cancer cell–cancer cell and cancer cell–endothelial cell TNTs formed was counted. The graph shows a significant reduction in the number of TNTs in the presence of inhibitors. The entire experiment was repeated three times (n = 3), and the data are presented as mean ±SEM. One-way ANOVA with Dunnett’s multiple comparisons test was performed for statistical analysis, and the following significance values were considered: * p < 0.05, ** p < 0.01, *** p < 0.001. (f) Representative bar plot of the dose-dependent reduction of cytoplasmic component transfer from cancer cells to endothelial cells in the presence of inhibitors. Cancer cells (MDA-MB-231) and endothelial cells (HUVECs) were loaded with CellTrace green (CFSE) and Dil-Ac-LDL, respectively, and employed in the co-culture setup in a 3D tumor matrix. Then, inhibitors were added to the co-culture in different concentrations. The transfer of CFSE-labeled cytoplasmic components from cancer cells to endothelial cells was evaluated using a flow cytometer after 24 h of co-culture. The bar plot represents the number of transfers of CFSE to endothelial cells from cancer cells. The experiment was repeated three times (n = 3) and the data were normalized with respect to 0 μM concentration and are presented as mean ±SEM. Two-way ANOVA with Dunnett’s multiple comparisons test was performed for statistical analysis, and the following significance values were considered: * p < 0.05, ** p < 0.01, *** p < 0.001, **** p < 0.0001.

