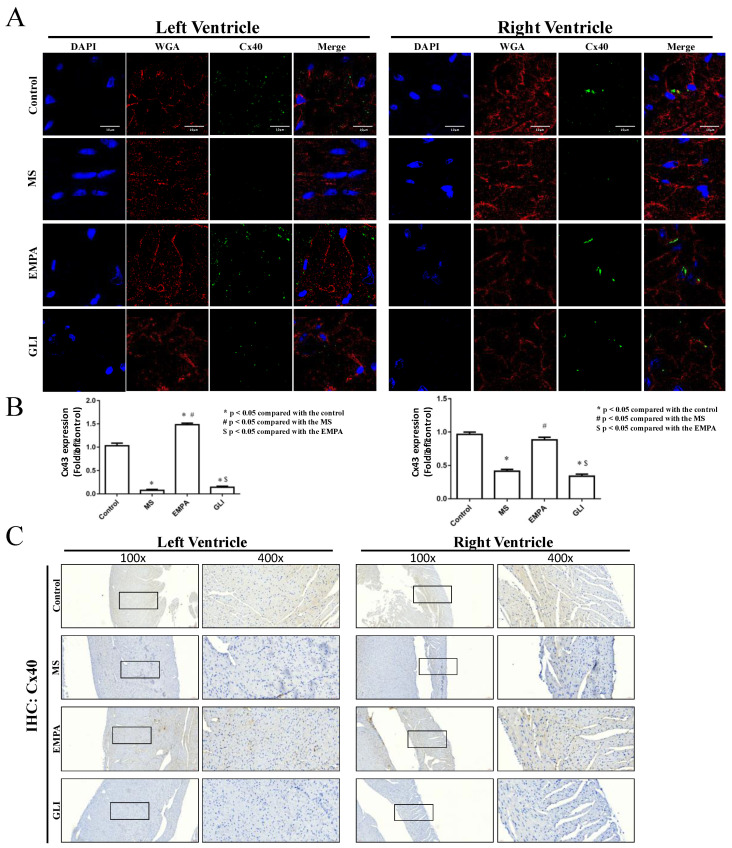
Figure 3.
Histological analysis of Cx40 in mouse ventricular tissue. (A) Confocal image of ventricles Cx40 immunofluorescence stain in the left ventricle (LV) (left panel) and the right ventricle (RV) (right panel) among the study groups (n = 5 for each group). Blue for DAPI (cell nucleus) staining, red for WGA (cell membrane) staining, and green for Cx40-positive staining. The scale bars indicate 10 μm. (Magnification: 1000×.) (B) The quantification of Cx40 expression integrated from a series of confocal image sections in the ventricles among the study groups. (C) IHC staining of Cx40 in mouse ventricles of each group. Blue for cell nucleus stain and brown for Cx40-positive stain. (Magnification: 100× and 400×.) *: p < 0.05 compared with the control group; #: p < 0.05 compared with the MS group; $: p < 0.05 compared with the EMPA group.

