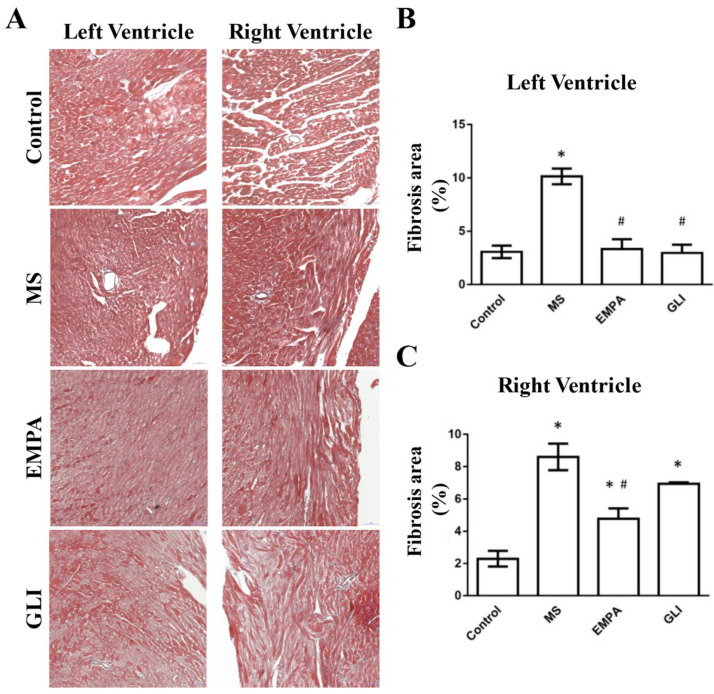
Figure 5.
(A) Histological fibrotic images of ventricles among the study groups (n = 5 for each group) as determined by Mason’s trichrome staining. Bar graphs of fibrotic areas in ventricles. (B) In the LV, the fibrotic areas in the MS were significantly increased compared with that in the control group. The fibrotic areas of the EMPA and GLI groups were significantly fewer than those in the MS group. (C) In the RV, the fibrotic areas in the MS, EMPA, and GLI groups were increased compared with those in the control group. The fibrotic areas in the EMPA group were still significantly fewer than those in the MS group. *: p < 0.05 compared with the control group; #: p < 0.05 compared with the MS group.

