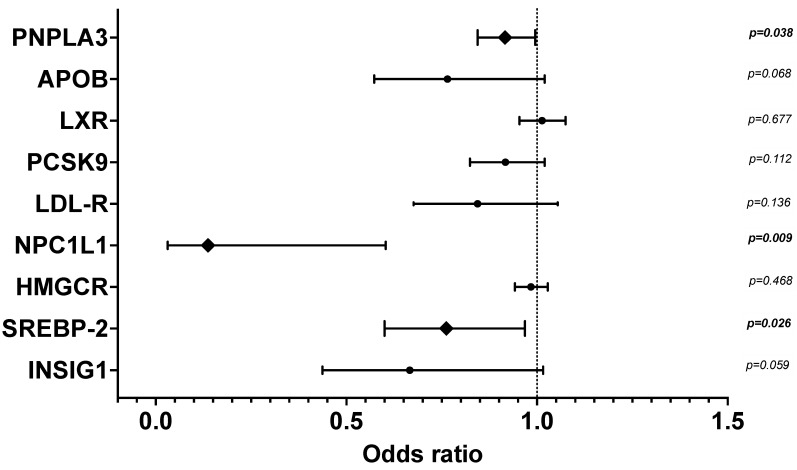
Figure 4.
Multivariate binary logistic regression of liver graft mRNA gene expression of selected proteins involved in lipid metabolism, for the presence of predominant Ld-MaS compared to nil-Steatosis. The 9 genes are listed on the y-axis, and the odds ratio with 95% confidence interval is shown on the x-axis. Data were adjusted for donor age, BMI and traumatic cause of death. APOB: apolipoprotein B; PNPLA3: Patatin-like phospholipase domain protein 3; HMGCR: 3-hydroxyl-3-methylglutaryl coenzyme A reductase; INSIG-1: insulin-induced gene 1; LDLR: LDL receptor; LXR: Liver X receptor; NPC1L1: Niemann-Pick C1-Like 1; PCSK9: Proprotein convertase subtilisin/kexin type 9; SREBP-2: sterol regulatory element-binding protein 2. The diamond symbol indicates the significant variables. p-values numbers marked in bold indicate numbers that are significant at the p < 0.05 level.

