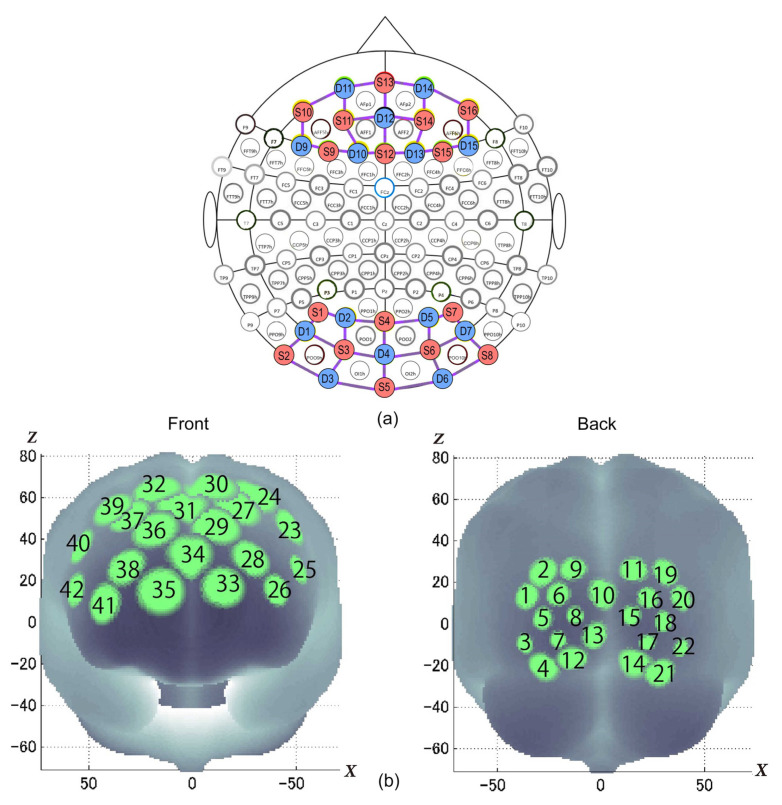
Figure 3.
(a) Montage map with optodes placement (sources (S) in red and detectors (D) in blue) and (b) statistically estimated fNIRS channel locations on the brain for two students, their spatial variability (SDs radii of the light green circles) associated with the estimation exhibited in MNI space. Front and back head views.

