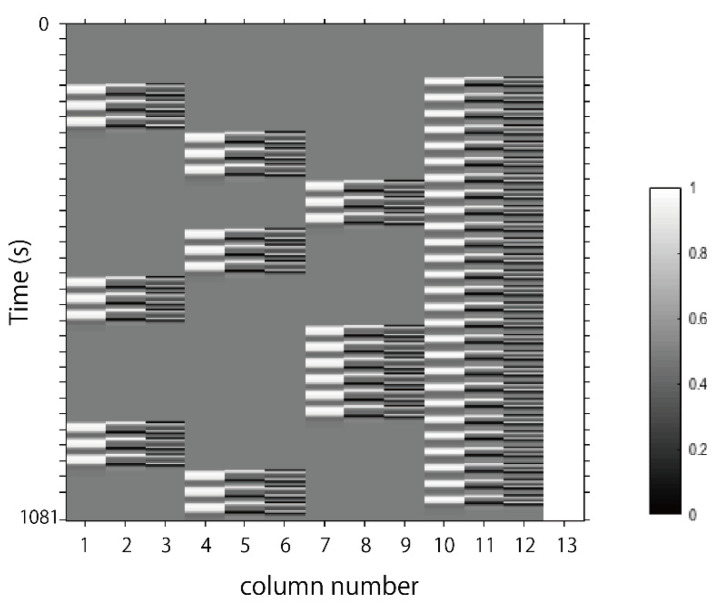
Figure 4.
An example of design matrix X. The first peak delay was set as τp = 6 s and “Time” indicates the row number of samples. The first to third columns indicate the canonical HRF f(τp, t), the derivatives, and the second derivatives, respectively, for site 1. The fourth to sixth columns indicate the canonical HRF f(τp, t), the derivatives, and the second derivatives, respectively, for site 2. The seventh to ninth columns indicate the canonical HRF f(τp, t), the derivatives, and the second derivatives, respectively, for site 3. The tenth to twelfth columns indicate the canonical HRF f(τp, t), the derivatives, and the second derivatives, respectively, for Rest. The thirteenth column indicates the constant.

