Figure 6.

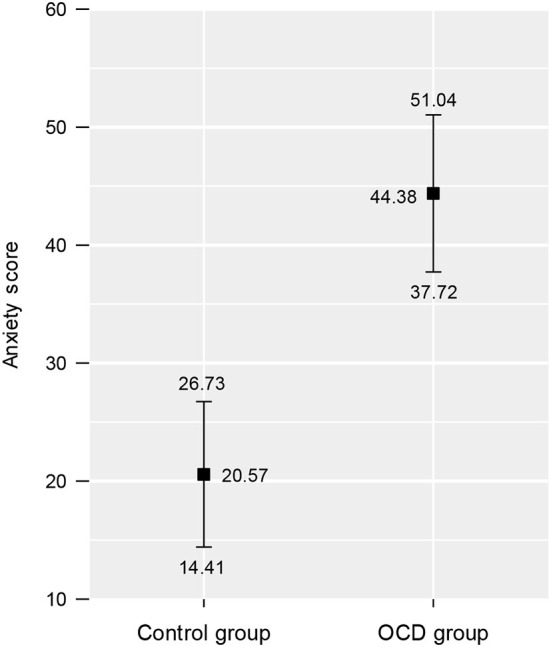
Overall mean anxiety scores across the augmented reality stimuli for the control and clinical groups. The squares represent the 20% trimmed means, and the intervals show the standard errors of the 20% trimmed means.

Overall mean anxiety scores across the augmented reality stimuli for the control and clinical groups. The squares represent the 20% trimmed means, and the intervals show the standard errors of the 20% trimmed means.