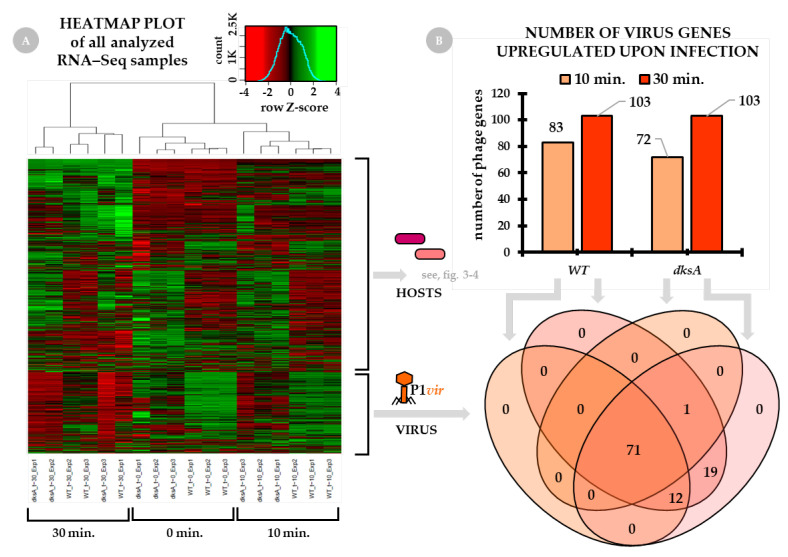
Figure 1.
Changes in global gene expression in the course of the virus-host interactions. The wild type and the dksA mutant cultures were infected with the P1vir phage at the beginning of the logarithmic phase of growth. Total RNA sequencing (RNA-seq) was performed for three post-infection time-points: 0 min (no-phage control), 10 min (early gene expression), and 30 min (late gene expression). Panel (A) presents the heatmap plot of all analyzed RNA-seq samples based on the expression of all detected genes of both hosts (wild type and dksA mutant) and the P1vir virus. Sample replicates (three for each condition) are listed below the heatmap. Gene expression data are presented as Z-score transformed, scaled in rows values. Panel (B) shows the number of P1vir phage genes which have been expressed at 10 and 30 min of infection. The Venn diagram below panel B shows the number of P1vir genes upregulated in the wild type and dksA mutant cells.

