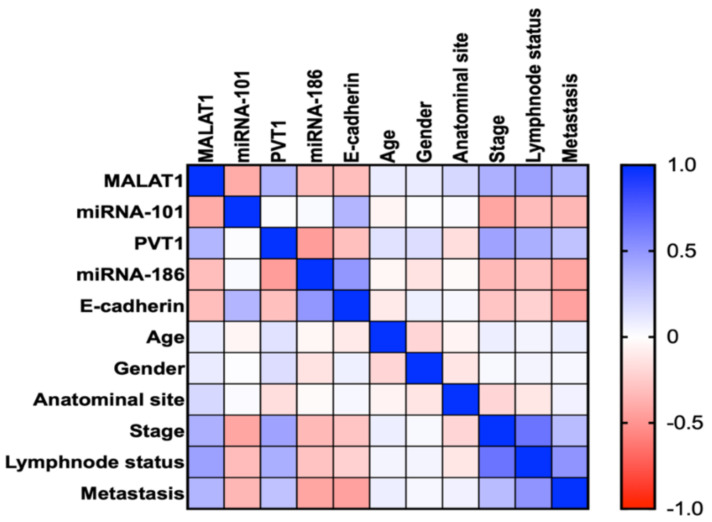
Figure 6.
Correlations between studied serum markers with each other and with clinical data in CRC group. A correlation map with a blue-red (cold-hot) scale. The blue color corresponds to a correlation close to 1 and the red color corresponds to a correlation close to −1. White corresponds to a correlation close to 0. Correlations are made by spearman correlation.

