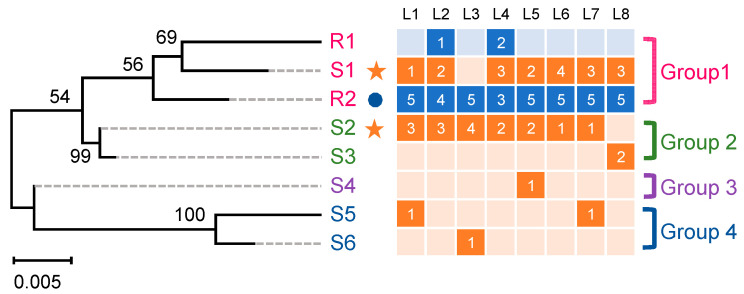
Figure 1.
Phylogenetic relationships of PxABCG1 promoter sequences amplified from the Bt-susceptible strain DBM1Ac-S and the Bt-resistant strain NIL-R. The phylogenetic tree was generated using the maximum likelihood (ML) method based on the model optimized using the Bayes Information Criterion with “complete deletion” as the gaps/missing data treatment and 1000 bootstrap replications. The classification of different PxABCG1 promoter sequences is shown on the right. Promoter sequences of the PxABCG1 gene were amplified from 8 susceptible DBM1Ac-S larvae and 8 resistant NIL-R larvae, respectively. L1 to L8 above represents each susceptible or resistant larva, and five clones from each larva were sequenced. Squares shaded in orange and blue represent susceptible and resistant larvae, respectively, and the number within the squares shows the number of the corresponding promoter detected in the 5 sequenced clones per larva. The orange star and the blue circle denote the major type of PxABCG1 promoter sequences in the susceptible and resistant larvae, respectively.

