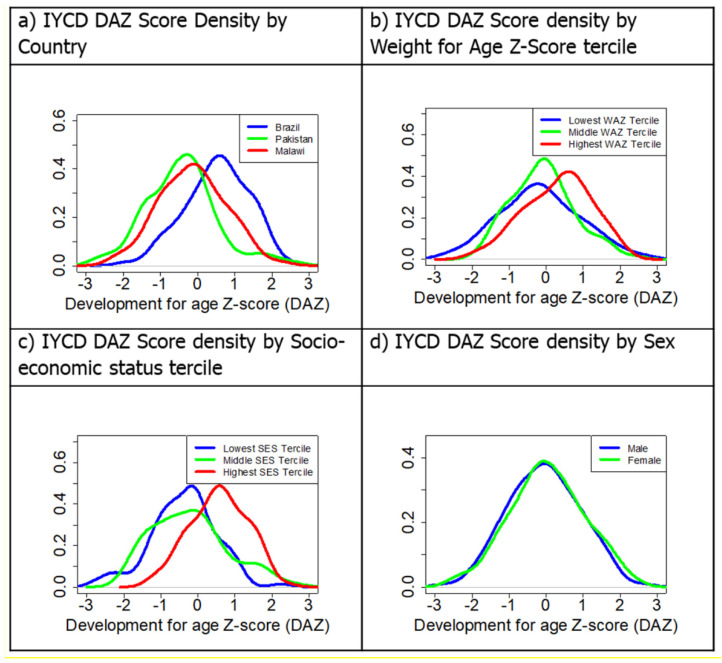
Figure 5.
Density plots of development-for-age z-scores (DAZ) by country, WAZ, SES and Sex. (a) Development for age z score by country, (b) development for age z score varying by weight for age z scores broken into terciles, (c) development for age z score by socioeconomic status broken up into terciles and (d) development for age z score by sex.

