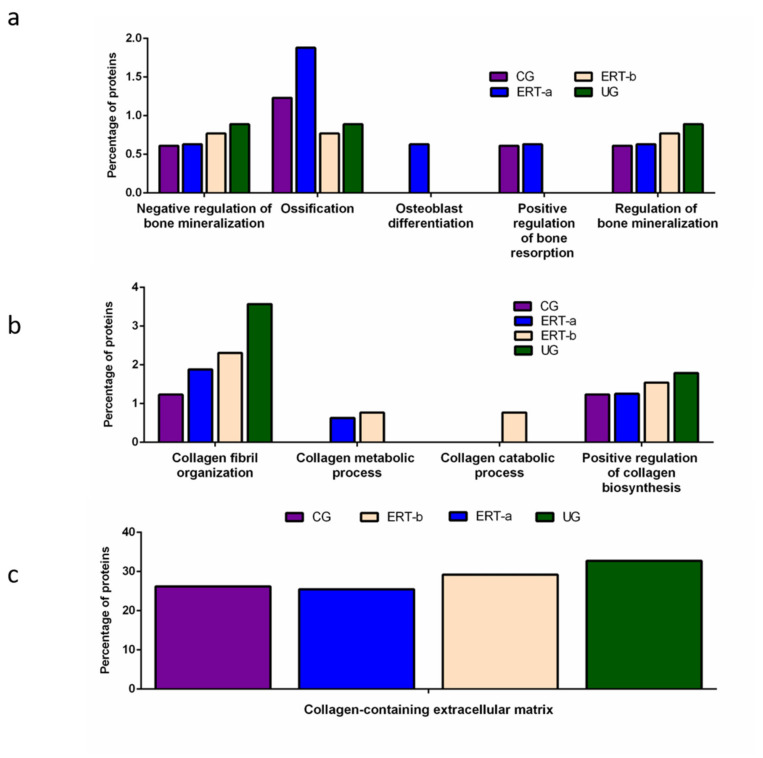
Figure 4.
Functional enrichment analysis using FunRich. Proteins identified in each the different groups were submitted to molecular functional analysis according to their involvement in: (a) processes that occur at the bone level; (b) collagen function (activity/processing/biosynthesis); (c) collagen-containing extracellular matrix. CG, control group; ERT-a, patients sampled before ERT; ERT-b, patients sampled 24 h after ERT; UG, untreated group. Proteins included in this analysis, identified in the qualitative proteomic analysis, are listed in the Supplementary Table S2.

