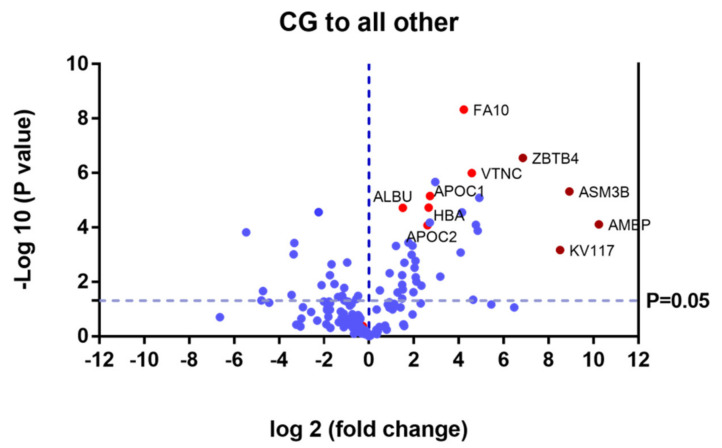
Figure 7.
Volcano plot showing the results of the SWATH analysis of plasma protein expression. Data are represented as the results obtained for the control group relative to all other groups (UG, ERT-a, and ERT-b). Graph shows the negative base 10 log of the p-value plotted against the base 2 log of the fold change for each protein included in the SWATH analysis. Changes were considered significant at p < 0.05 and fold change >1.5 compared with control group.

