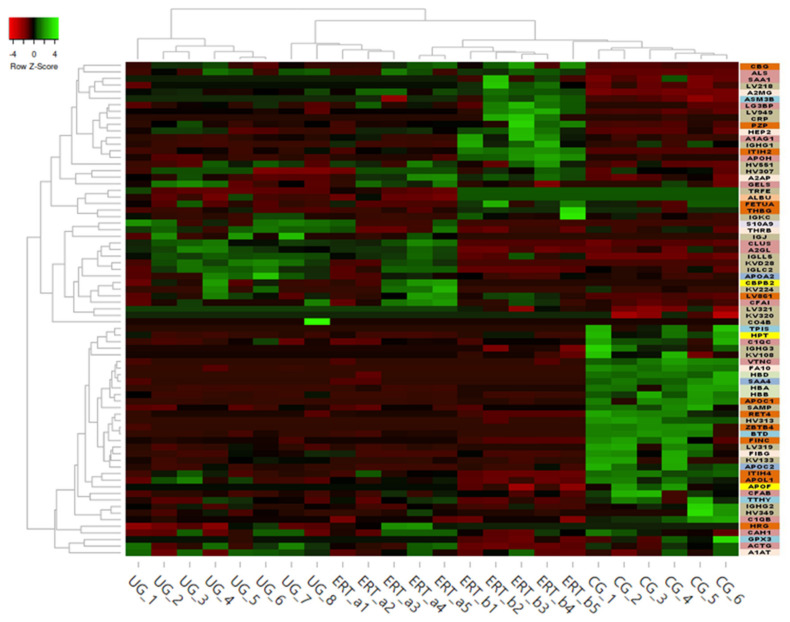
Figure 8.
Heatmap depicting the expression profiles of different proteins (also shown in Table 2, Table 3 and Table 4) as determined by SWATH quantitative analysis. The relative abundance of each protein is reflected by the colors in the heatmap, based on the z-score of the protein’s normalized peak area. The dendrogram represents the biological replicates of the UG, ERT-a, ERT-b, and CG groups. Proteins, listed in the sidebar on the right, are color coded according to their function, as follows: apolipoprotein-related proteins, dark green; blood coagulation, purple; calcium binding, dark orange; carrier proteins, light green; cytoskeletal proteins, light pink; immune system, grey; metabolic processes, yellow; metabolic interconversion, light blue; other functions, white; protein binding, pink; transport, light grey.

