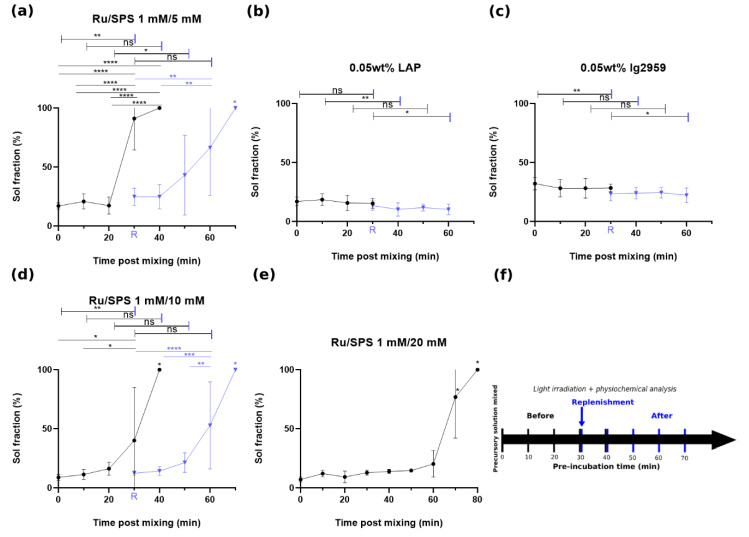
Figure 1.
Sol fraction of GelAGE versus pre-incubation time prior to crosslinking with flow chart, circle (•) represents crosslinking with designated time of pre-incubation and triangle (▼) represents the samples with further pre-incubation after replenishment of photoinitiator at t = 30 min: (a) Sol fraction: 1 mM/5 mM Ru/SPS, (b) Sol fraction: LAP, (c) Sol fraction: Ig2959, (d) Sol fraction: 1 mM/10 mM Ru/SPS, (e) Sol fraction: 1 mM/20 mM Ru/SPS and (f) flow chart of the experiment. Values in the figures represent means and standard deviation of N = 9 replicates. Capped lines are for comparison with different groups (before and after replenishment). Asterisks (*) represents values statistically significant at the p < 0.05 level, ** for p < 0.01, *** for p < 0.001 and **** for p < 0.0001. ns represents values statistically non-signigicant.

