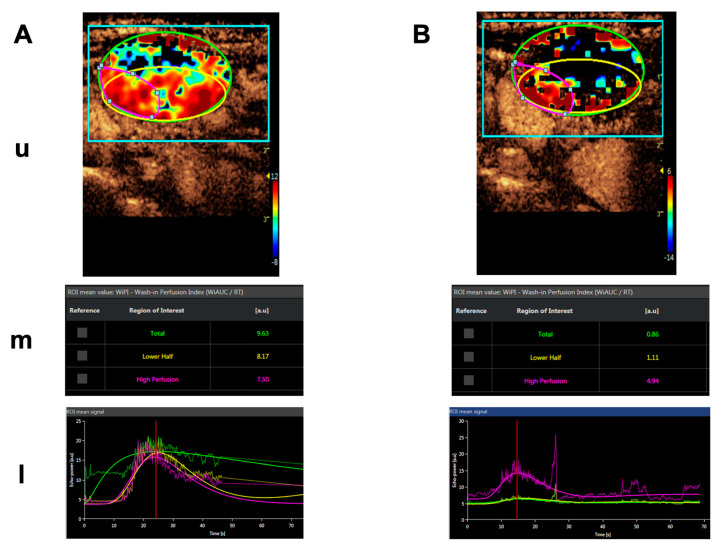
Figure 4.
Contrast-enhanced ultrasound (CEUS) imaging series of a lymphnode metastasis of a medullary thyroid carcinoma. (A). Shortly before treatment. (B). After 5 days of daily treatment with 4 mg/m2 bsa tTF-NGR. Upper panels for (A,B) (u): Heat maps of dynamic CEUS. Color scales at the right lower corner of each photograph semiquantify contrast perfusion (red = high, blue/black = low). The green circles represent “regions of interest” (ROI) for the “total” lesion, the yellow circles represent the “lower half” of the lesion, and the red circles represent a “high perfusion” area of the lesion. Middle panels for (A,B) (m): CEUS arbitrary units (a.u.) for the wash-in perfusion index (WIAUC/RT; for the methodological details see [88]) representing the contrast flow through the vasculature of the lesion. For color representation of the 3 different ROI measured, see upper panel. Lower panels for (A,B) (l): Graphic follow-up of the wash-in perfusion index representing the contrast flow through the vasculature of the lesion for 70 sec starting with the injection of contrast via peak-enhancement until wash-out. For color representation of the 3 different “regions of interest” (ROI) see upper and middle panels.

