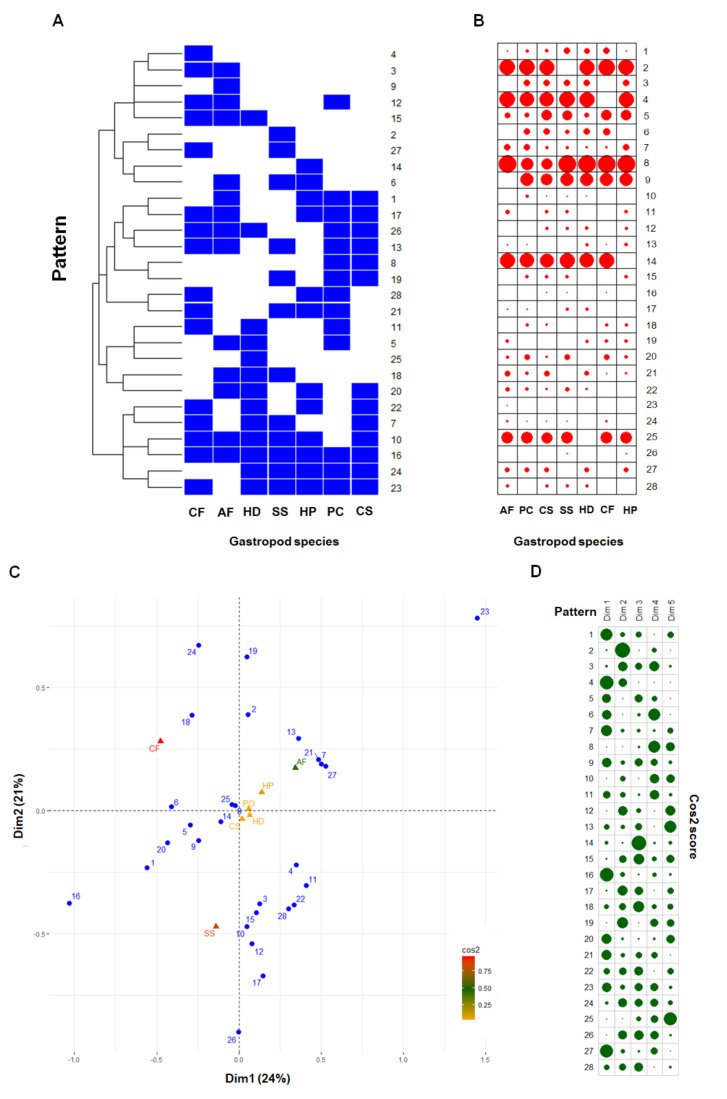
Figure 4.
Correspondence analysis of 28 patterns of variable peptides in the mucus of seven gastropod species. Blue squares in the heatmap (A) indicate the presence of the peptide, and white squares indicate the absence of a peptide. The sizes of the red circles in the balloon plot (B) indicate the number of peptides within each pattern. The biplot (C) shows global patterns of the variable peptides (blue circles) and the gastropod species (triangles) according to the first two dimensions (Dim1 and Dim2). Colors of the square cosine scores indicate the gastropod species. The scores for the first five dimensions (Dim1 to Dim5) are shown in (D), and the sizes of the green circles represent the score level. AF = Achatina fulica; PC = Pomacea canaliculata; CS = Cryptozona siamensis; SS = Semperula siamensis; HD = Hemiplecta distincta; CF = Cyclophorus fulguratus; and HP = Helix pomatia.

