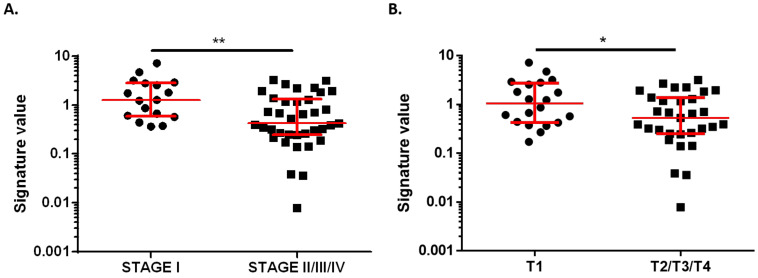
Figure 4.
Association between combined signature value and clinicopathological data. (A) Signature value in plasma samples from very early-stage BC patients (stage I, n = 17) and in patients with advanced disease (stage II, III, IV, n = 37). (B) Signature value in plasma samples from BC patients with tumor size ≤ 20 mm (T1, n = 20) and in patients with tumor size >20 mm (T2, T3, T4, n = 31). Red lines represent median ± interquartile range. * p < 0.05; ** p < 0.01.

