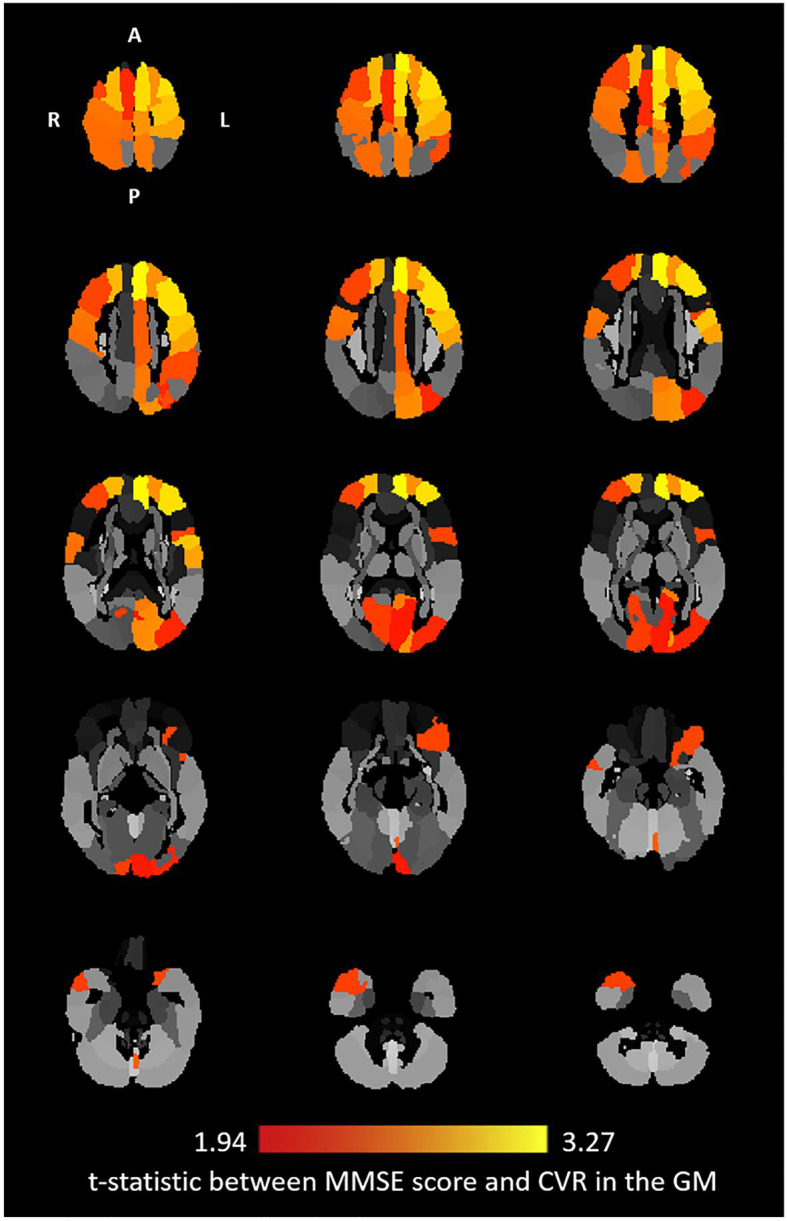
Figure 3.

Covariates adjusted t-statistic: axial view of the relationship between CVR and MMSE score at the regional level in the gray matter. Twenty-six ROIs were reported from the multivariate linear regression where corrected value of p < 0.05 [Automated Anatomical Labeling (AAL) ROIs: Left Precentral, Right Precentral, Left Superior Frontal, Right Superior Frontal, Left Middle Frontal, Right Middle Frontal, Left Inferior Frontal Operculum, Left Inferior Frontal Orbital, Left Superior Motor, Right Superior Motor, Left Superior Medial Frontal, Left Middle Cingulum, Left Calcarine, Right Calcarine, Left Cuneus, Left Superior Occipital, Left Middle Occipital, Left Postcentral, Right Postcentral, Right Superior Parietal, Left Inferior Parietal, Left Precuneus, Left Central Paracentral Lobule, Right Central Paracentral Lobule, Right Middle Temporal Pole, and Left Vermis 6]. The brightest yellow color corresponds to a maximum t-statistic among the regions.
