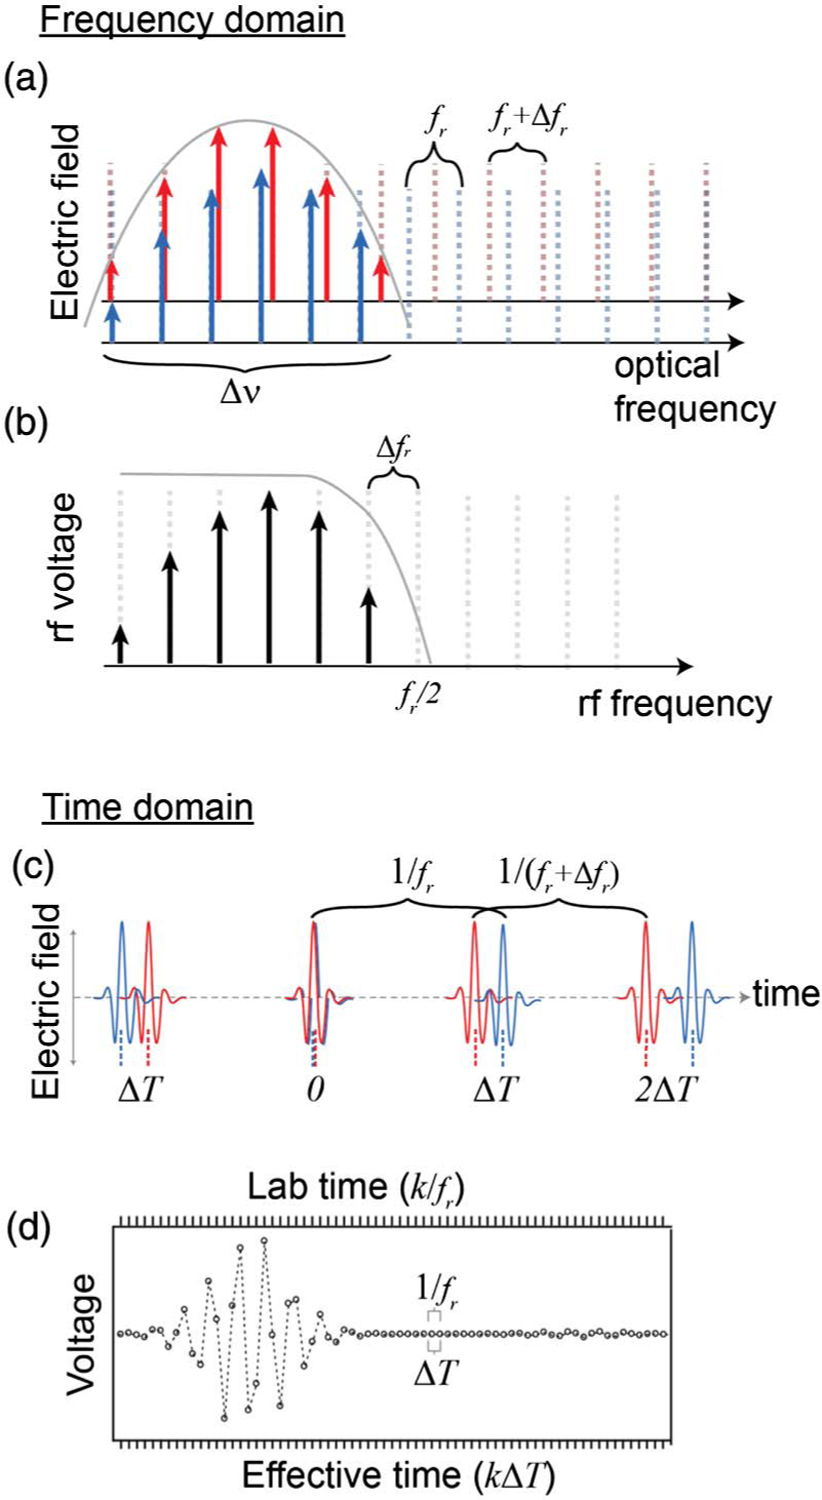
Fig. 3.

(a) Two frequency combs (red and blue) are mixed to produce (b) the rf comb. Solid gray lines indicate filter functions applied in the rf and optical to avoid aliasing effects. (c) The equivalent time-domain picture showing the pulse-to-pulse walk-off between the two comb pulse trains. (d) The photoreceiver voltage output corresponds to the product of the two comb pulses, integrated over the receiver bandwidth. This output can be viewed in laboratory time, where the samples are at time intervals of 1∕fr, or in effective time, where the samples are at time intervals of ΔT (as with FTIR interferograms). In both time scales k is the sample number. The large “centerburst” corresponds to the simultaneous arrival of the two pulses. Also visible in the “tail” to the right is a weak ringing containing absorption information of the sample gas.
