
Fig. 5.
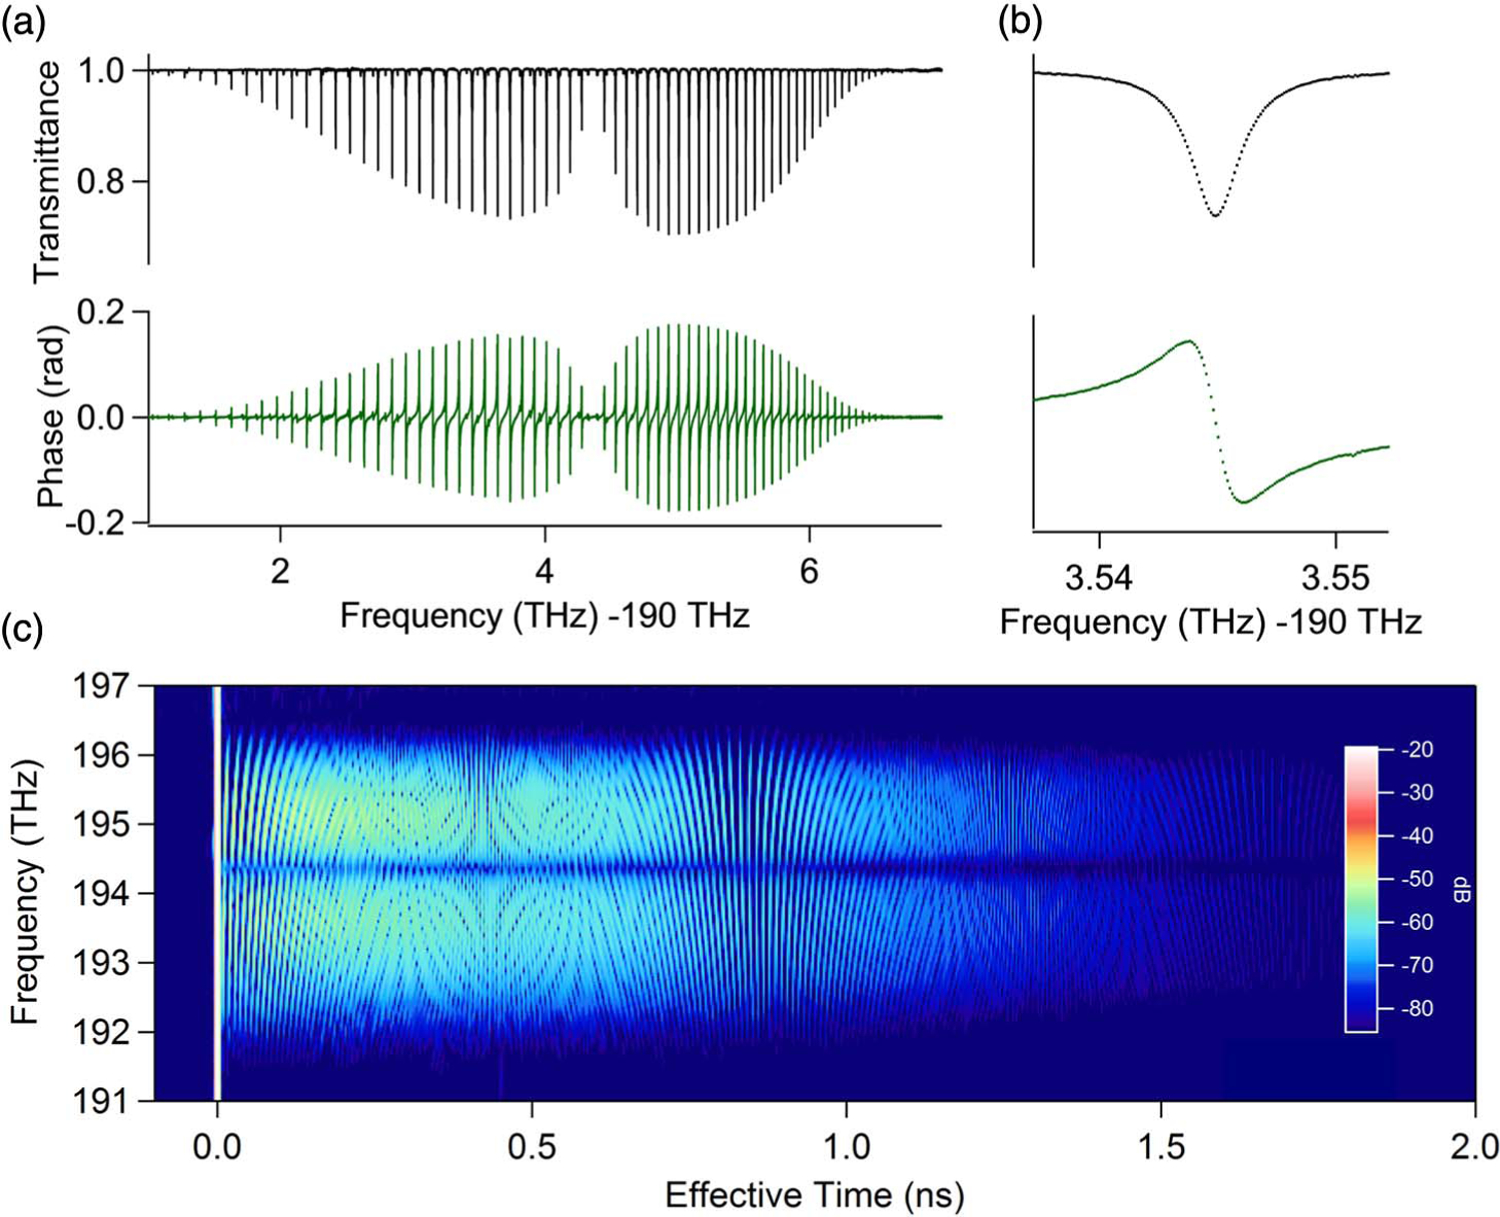
Signature of the full rotational band from the C-H overtone of HCN gas as measured in the dispersive dual-comb spectrometer configuration [19]. (a) The phase and amplitude signature at 100 MHz point spacing has a signal-to-noise ratio per point of ∼4000 with respect to unity transmission; (b) expanded view showing the spectral sampling points; (c) joint time–frequency domain signature from the short-time Fourier transform of the data that clearly shows the free-induction decay signals in the “P” and “R” branches as vertical stripes. The overall decay results from Doppler and collisional dephasing.